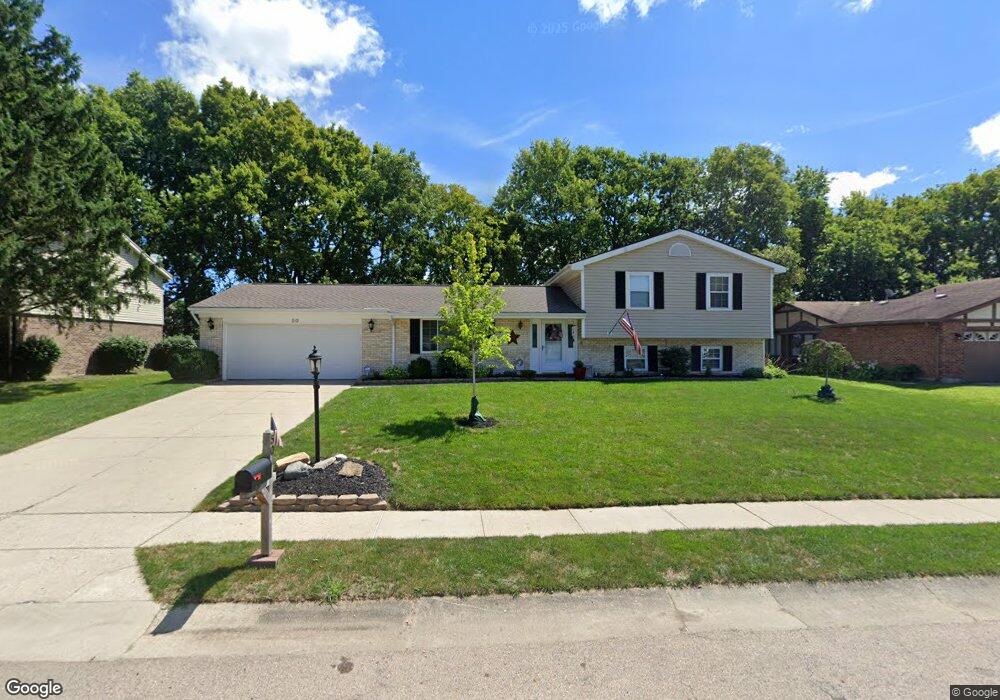
50 Clearview Dr Springboro, OH 45066
Estimated Value: $311,000 - $372,000
3
Beds
3
Baths
1,469
Sq Ft
$234/Sq Ft
Est. Value
About This Home
This home is located at 50 Clearview Dr, Springboro, OH 45066 and is currently estimated at $343,875, approximately $234 per square foot. 50 Clearview Dr is a home located in Warren County with nearby schools including Clearcreek Elementary School, Springboro Intermediate School, and Dennis Elementary School.
Ownership History
Date
Name
Owned For
Owner Type
Purchase Details
Closed on
Mar 25, 2005
Sold by
Sexton Sharon L and Sexton Jeffrey A
Bought by
Pisula Joseph T and Pisula Shelley K
Current Estimated Value
Home Financials for this Owner
Home Financials are based on the most recent Mortgage that was taken out on this home.
Original Mortgage
$129,600
Outstanding Balance
$64,070
Interest Rate
5.64%
Mortgage Type
Fannie Mae Freddie Mac
Estimated Equity
$279,805
Purchase Details
Closed on
Mar 9, 1984
Sold by
Canter Pamela S and Canter Pamela S
Bought by
Caswell and Caswell Rex A
Purchase Details
Closed on
Mar 17, 1982
Sold by
Canter Canter and Canter Stephen A
Purchase Details
Closed on
Jul 14, 1978
Sold by
Tri Ohio Dev Co
Purchase Details
Closed on
Mar 17, 1978
Sold by
Tri-Ohio Dev Co
Create a Home Valuation Report for This Property
The Home Valuation Report is an in-depth analysis detailing your home's value as well as a comparison with similar homes in the area
Home Values in the Area
Average Home Value in this Area
Purchase History
| Date | Buyer | Sale Price | Title Company |
|---|---|---|---|
| Pisula Joseph T | $162,000 | G W Land Title | |
| Caswell | $88,900 | -- | |
| -- | -- | -- | |
| -- | $29,700 | -- | |
| -- | -- | -- |
Source: Public Records
Mortgage History
| Date | Status | Borrower | Loan Amount |
|---|---|---|---|
| Open | Pisula Joseph T | $129,600 | |
| Closed | Pisula Joseph T | $24,300 |
Source: Public Records
Tax History
| Year | Tax Paid | Tax Assessment Tax Assessment Total Assessment is a certain percentage of the fair market value that is determined by local assessors to be the total taxable value of land and additions on the property. | Land | Improvement |
|---|---|---|---|---|
| 2025 | $3,545 | $90,770 | $24,500 | $66,270 |
| 2024 | $3,545 | $90,770 | $24,500 | $66,270 |
| 2023 | $3,102 | $72,838 | $16,520 | $56,318 |
| 2022 | $3,056 | $72,839 | $16,520 | $56,319 |
| 2021 | $2,844 | $72,839 | $16,520 | $56,319 |
| 2020 | $2,757 | $61,726 | $14,000 | $47,726 |
| 2019 | $2,542 | $61,726 | $14,000 | $47,726 |
| 2018 | $2,544 | $61,726 | $14,000 | $47,726 |
| 2017 | $2,403 | $52,525 | $12,096 | $40,429 |
| 2016 | $2,506 | $52,525 | $12,096 | $40,429 |
| 2015 | $2,478 | $52,525 | $12,096 | $40,429 |
| 2014 | $2,478 | $49,090 | $11,310 | $37,780 |
| 2013 | $2,476 | $60,790 | $14,000 | $46,790 |
Source: Public Records
Map
Nearby Homes
- 225 Renwood Place
- 245 Whispering Pines St
- 35 Edgebrooke Dr
- 23 Pheasant Run Cir Unit 9A
- 10 Woods Rd
- 4 Chestnut St
- 72 Pebble Brook Place
- 340 Saint James Place
- 350 Spruceway Dr
- 80 Elkins Ln
- 70 Eleanor Dr
- 40 Libby Hollow St
- 45 Wadestone St
- 90 Libby Hollow St
- 20 Terradyne Trace
- 140 Dan Haven Place
- 15 Wadestone Ln
- 105 Cherry St
- 65 Ed Knoll Bend
- 84 W Mill St
Your Personal Tour Guide
Ask me questions while you tour the home.