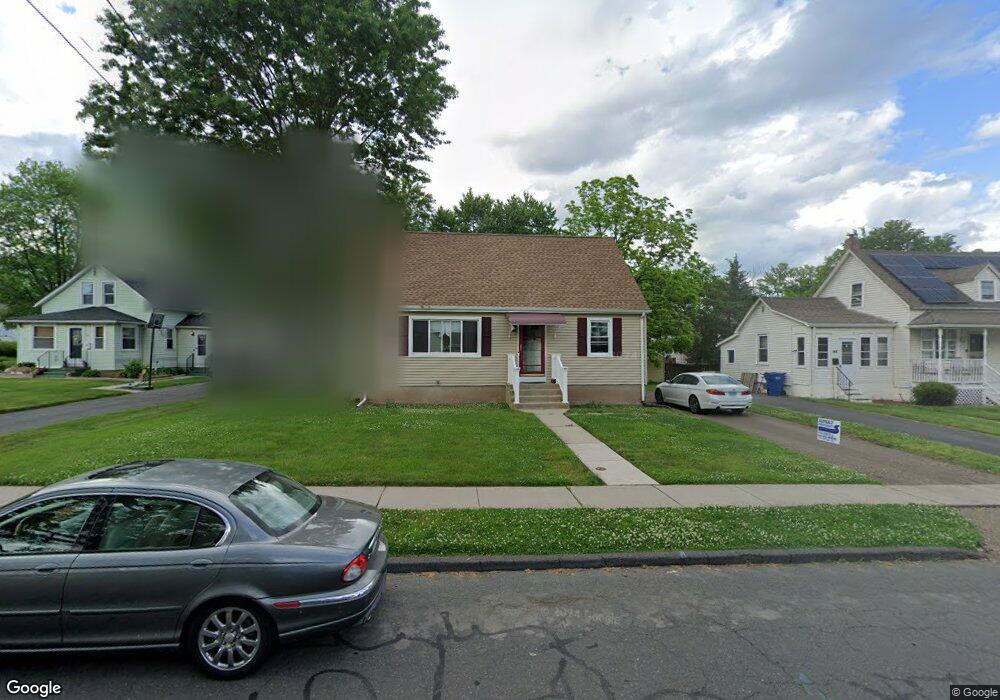
50 Corey St Windsor, CT 06095
Wilson NeighborhoodEstimated Value: $304,000 - $332,000
3
Beds
2
Baths
1,306
Sq Ft
$243/Sq Ft
Est. Value
About This Home
This home is located at 50 Corey St, Windsor, CT 06095 and is currently estimated at $317,931, approximately $243 per square foot. 50 Corey St is a home located in Hartford County with nearby schools including Poquonock Elementary School, Clover Street School, and Sage Park Middle School.
Ownership History
Date
Name
Owned For
Owner Type
Purchase Details
Closed on
Oct 4, 2024
Sold by
Smith Mildred N
Bought by
Smith Lauren T
Current Estimated Value
Purchase Details
Closed on
Aug 16, 2019
Sold by
Smith Mildred N
Bought by
Smith Mildred N and Smith Lauren T
Create a Home Valuation Report for This Property
The Home Valuation Report is an in-depth analysis detailing your home's value as well as a comparison with similar homes in the area
Home Values in the Area
Average Home Value in this Area
Purchase History
| Date | Buyer | Sale Price | Title Company |
|---|---|---|---|
| Smith Lauren T | -- | None Available | |
| Smith Lauren T | -- | None Available | |
| Smith Mildred N | -- | -- |
Source: Public Records
Tax History
| Year | Tax Paid | Tax Assessment Tax Assessment Total Assessment is a certain percentage of the fair market value that is determined by local assessors to be the total taxable value of land and additions on the property. | Land | Improvement |
|---|---|---|---|---|
| 2025 | $5,495 | $174,720 | $39,200 | $135,520 |
| 2024 | $5,822 | $174,720 | $39,200 | $135,520 |
| 2023 | $3,669 | $100,240 | $27,860 | $72,380 |
| 2022 | $3,636 | $100,240 | $27,860 | $72,380 |
| 2021 | $3,636 | $100,240 | $27,860 | $72,380 |
| 2020 | $3,620 | $100,240 | $27,860 | $72,380 |
| 2019 | $3,546 | $100,240 | $27,860 | $72,380 |
| 2018 | $3,506 | $97,510 | $27,860 | $69,650 |
| 2017 | $3,164 | $97,510 | $27,860 | $69,650 |
| 2016 | $3,074 | $97,510 | $27,860 | $69,650 |
| 2015 | $3,015 | $97,510 | $27,860 | $69,650 |
| 2014 | $2,971 | $97,510 | $27,860 | $69,650 |
Source: Public Records
Map
Nearby Homes
Your Personal Tour Guide
Ask me questions while you tour the home.