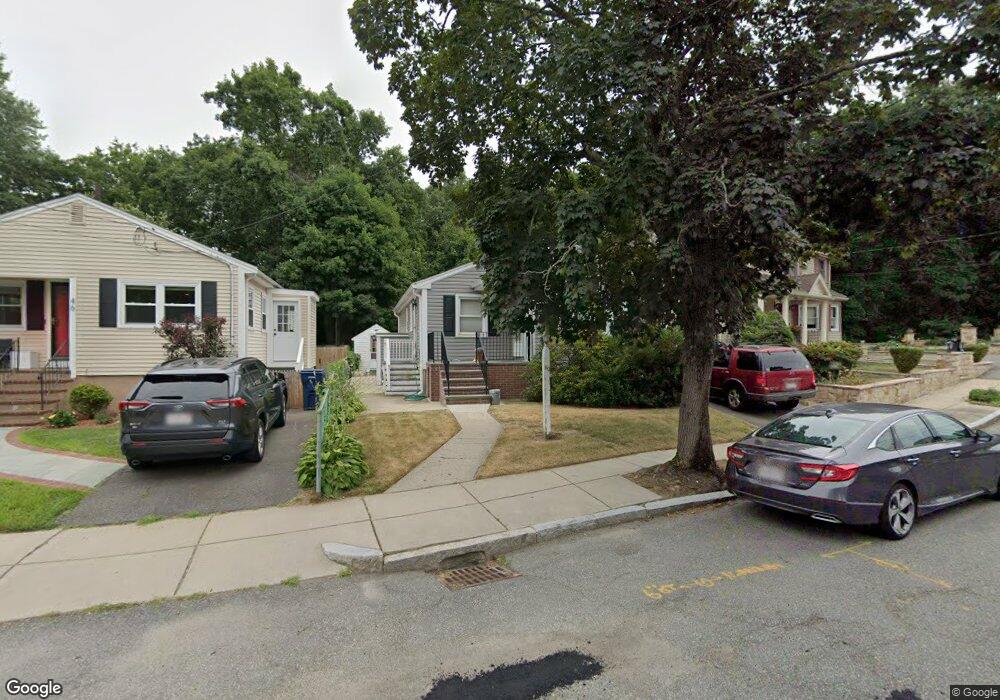
50 Crosstown Ave West Roxbury, MA 02132
Upper Washington-Spring Street NeighborhoodEstimated Value: $649,000 - $675,000
2
Beds
2
Baths
1,056
Sq Ft
$627/Sq Ft
Est. Value
About This Home
This home is located at 50 Crosstown Ave, West Roxbury, MA 02132 and is currently estimated at $661,841, approximately $626 per square foot. 50 Crosstown Ave is a home located in Suffolk County with nearby schools including St Theresa School, Catholic Memorial School, and The Roxbury Latin School.
Ownership History
Date
Name
Owned For
Owner Type
Purchase Details
Closed on
Feb 3, 2025
Sold by
Lee Thomas C
Bought by
Thomas C Lee Ret and Lee
Current Estimated Value
Purchase Details
Closed on
Jun 10, 2011
Sold by
Salcedo Rafael
Bought by
Lee Thomas C
Home Financials for this Owner
Home Financials are based on the most recent Mortgage that was taken out on this home.
Original Mortgage
$253,214
Interest Rate
5.25%
Mortgage Type
FHA
Purchase Details
Closed on
May 13, 2004
Sold by
Dugan John G
Bought by
Soloranzo Aymara B and Martinez Aura
Purchase Details
Closed on
Sep 13, 2002
Sold by
Lu Qing and Xin Mei
Bought by
Kiessling Linda H
Purchase Details
Closed on
Dec 1, 1998
Sold by
Dion Philip F and Dion Helen S
Bought by
Lu Qing and Xin Mei
Create a Home Valuation Report for This Property
The Home Valuation Report is an in-depth analysis detailing your home's value as well as a comparison with similar homes in the area
Home Values in the Area
Average Home Value in this Area
Purchase History
| Date | Buyer | Sale Price | Title Company |
|---|---|---|---|
| Thomas C Lee Ret | -- | None Available | |
| Lee Thomas C | $225,000 | -- | |
| Soloranzo Aymara B | $334,000 | -- | |
| Kiessling Linda H | $311,000 | -- | |
| Lu Qing | $167,000 | -- | |
| Lee Thomas C | $225,000 | -- | |
| Soloranzo Aymara B | $334,000 | -- | |
| Kiessling Linda H | $311,000 | -- | |
| Lu Qing | $167,000 | -- |
Source: Public Records
Mortgage History
| Date | Status | Borrower | Loan Amount |
|---|---|---|---|
| Previous Owner | Lee Thomas C | $253,214 | |
| Previous Owner | Lu Qing | $278,500 |
Source: Public Records
Tax History Compared to Growth
Tax History
| Year | Tax Paid | Tax Assessment Tax Assessment Total Assessment is a certain percentage of the fair market value that is determined by local assessors to be the total taxable value of land and additions on the property. | Land | Improvement |
|---|---|---|---|---|
| 2025 | $6,347 | $548,100 | $166,600 | $381,500 |
| 2024 | $5,708 | $523,700 | $176,100 | $347,600 |
| 2023 | $5,625 | $523,700 | $176,100 | $347,600 |
| 2022 | $5,180 | $476,100 | $160,100 | $316,000 |
| 2021 | $4,780 | $448,000 | $152,500 | $295,500 |
| 2020 | $4,373 | $414,100 | $142,100 | $272,000 |
| 2019 | $4,120 | $390,900 | $117,600 | $273,300 |
| 2018 | $3,792 | $361,800 | $117,600 | $244,200 |
| 2017 | $3,785 | $357,400 | $117,600 | $239,800 |
| 2016 | $3,709 | $337,200 | $117,600 | $219,600 |
| 2015 | $3,709 | $306,300 | $127,800 | $178,500 |
| 2014 | $3,602 | $286,300 | $127,800 | $158,500 |
Source: Public Records
Map
Nearby Homes
- 199 Glenellen Rd
- 191 Glenellen Rd
- 110 New Haven St
- 55 Cottage Rd
- 5245 Washington St Unit 5
- 115 Grove St Unit 11
- 111 Grove St Unit 6
- 150 Grove St
- 25R Rockland St Unit 6
- 11 Cheriton Rd Unit 102B
- 235 Curve St
- 57 Rockland St
- 1515 Vfw Pkwy Unit M19
- 70 Birchwood St
- 80 Caledonian Ave
- 94 Rockland St
- 14 Wiggin Ave
- 14 Arbor Ln
- 45 Weymouth Ave
- 12 Bronx Rd
- 46 Crosstown Ave
- 54 Crosstown Ave
- 42 Crosstown Ave
- 38 Crosstown Ave Unit 1
- 39 Crosstown Ave
- 141 Salman St
- 34 Crosstown Ave
- 35 Crosstown Ave
- 134 Salman St
- 137 Salman St
- 30 Crosstown Ave
- 121 Vogel St
- 55 Crosstown Ave
- 128 Salman St
- 133 Salman St
- 26 Crosstown Ave
- 117 Vogel St
- 129 Salman St
- 59 Crosstown Ave
- 29 Crosstown Ave