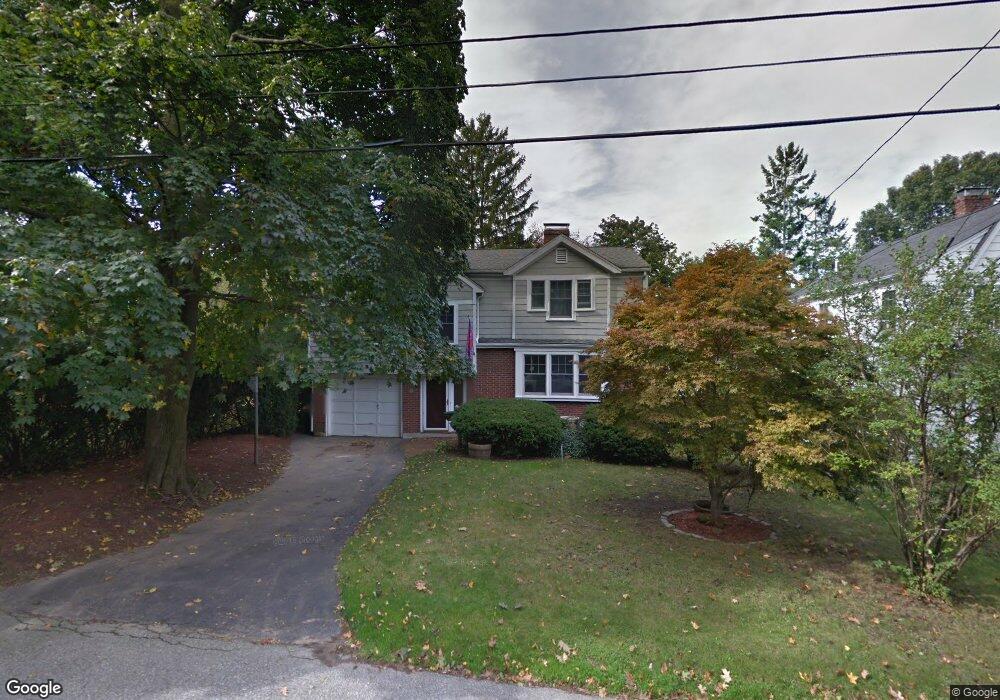
50 Dexter Rd Lexington, MA 02420
North Lexington NeighborhoodEstimated Value: $1,146,000 - $1,380,000
2
Beds
3
Baths
1,817
Sq Ft
$677/Sq Ft
Est. Value
About This Home
This home is located at 50 Dexter Rd, Lexington, MA 02420 and is currently estimated at $1,229,538, approximately $676 per square foot. 50 Dexter Rd is a home located in Middlesex County with nearby schools including Joseph Estabrook Elementary School, William Diamond Middle School, and Lexington High School.
Ownership History
Date
Name
Owned For
Owner Type
Purchase Details
Closed on
Jun 18, 1990
Sold by
Ruplinger William D
Bought by
Tambor Eric D
Current Estimated Value
Home Financials for this Owner
Home Financials are based on the most recent Mortgage that was taken out on this home.
Original Mortgage
$182,400
Interest Rate
10.54%
Mortgage Type
Purchase Money Mortgage
Create a Home Valuation Report for This Property
The Home Valuation Report is an in-depth analysis detailing your home's value as well as a comparison with similar homes in the area
Home Values in the Area
Average Home Value in this Area
Purchase History
| Date | Buyer | Sale Price | Title Company |
|---|---|---|---|
| Tambor Eric D | $228,000 | -- |
Source: Public Records
Mortgage History
| Date | Status | Borrower | Loan Amount |
|---|---|---|---|
| Open | Tambor Eric D | $200,000 | |
| Closed | Tambor Eric D | $35,000 | |
| Closed | Tambor Eric D | $182,400 | |
| Previous Owner | Tambor Eric D | $128,000 |
Source: Public Records
Tax History
| Year | Tax Paid | Tax Assessment Tax Assessment Total Assessment is a certain percentage of the fair market value that is determined by local assessors to be the total taxable value of land and additions on the property. | Land | Improvement |
|---|---|---|---|---|
| 2025 | $15,190 | $1,242,000 | $774,000 | $468,000 |
| 2024 | $14,749 | $1,204,000 | $737,000 | $467,000 |
| 2023 | $14,040 | $1,080,000 | $670,000 | $410,000 |
| 2022 | $13,110 | $950,000 | $609,000 | $341,000 |
| 2021 | $12,678 | $881,000 | $555,000 | $326,000 |
| 2020 | $12,645 | $900,000 | $555,000 | $345,000 |
| 2019 | $12,157 | $861,000 | $529,000 | $332,000 |
| 2018 | $11,869 | $830,000 | $504,000 | $326,000 |
| 2017 | $11,737 | $810,000 | $493,000 | $317,000 |
| 2016 | $11,111 | $761,000 | $449,000 | $312,000 |
| 2015 | $10,699 | $720,000 | $408,000 | $312,000 |
| 2014 | $9,709 | $626,000 | $371,000 | $255,000 |
Source: Public Records
Map
Nearby Homes
- 63 Dexter Rd
- 10 Preston Rd
- 10 Dexter Rd
- 109 Simonds Rd
- 9 Hillside Terrace
- 18 Robinson Rd
- 17 Hamilton Rd
- 25 Flintlock Rd
- 24 Donald St
- 18 Victory Garden Way
- 1 Revere St
- 4 Whittier Rd
- 18 Hill St
- 58 Hill St
- 93 Bedford St Unit 101
- 93 Bedford St Unit 201
- 93 Bedford St Unit 308
- 93 Bedford St Unit 108
- 23 Dewey Rd
- 79 Bedford St Unit 79
Your Personal Tour Guide
Ask me questions while you tour the home.