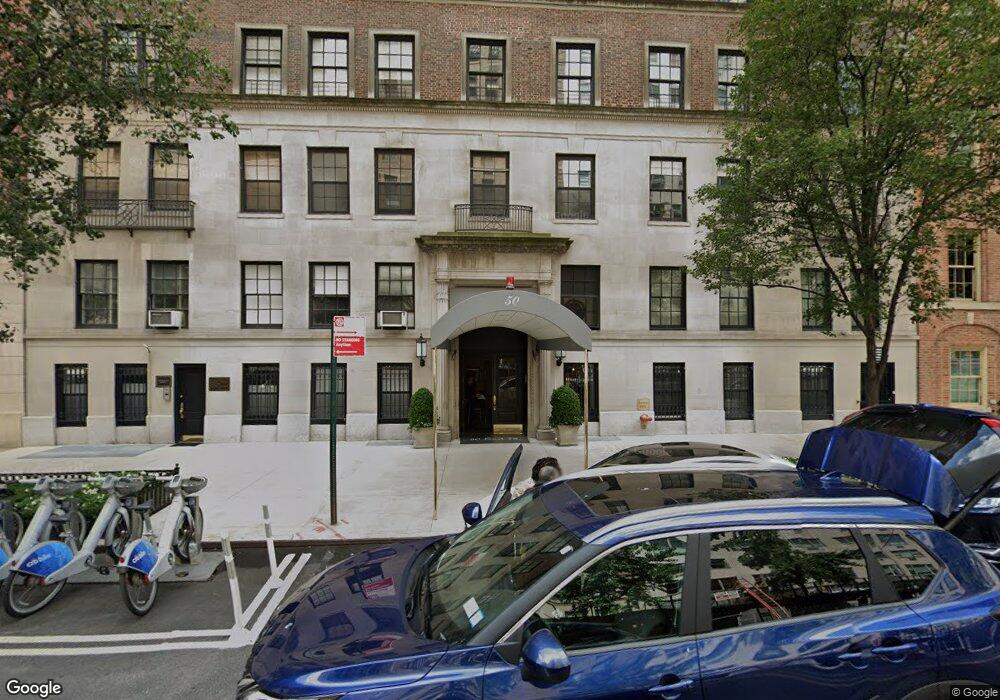
50 E 72nd St Unit 12B New York, NY 10021
Upper East Side NeighborhoodEstimated Value: $2,166,000 - $3,587,000
--
Bed
--
Bath
1,610
Sq Ft
$1,656/Sq Ft
Est. Value
About This Home
This home is located at 50 E 72nd St Unit 12B, New York, NY 10021 and is currently estimated at $2,666,179, approximately $1,656 per square foot. 50 E 72nd St Unit 12B is a home located in New York County with nearby schools including East Side Elementary School, P.S. 267, Robert F Wagner Middle School, and Clinton School.
Ownership History
Date
Name
Owned For
Owner Type
Purchase Details
Closed on
Mar 8, 2018
Sold by
Benzak Virginia A
Bought by
Virginia S Benzak Revocable Trust
Current Estimated Value
Purchase Details
Closed on
Feb 15, 2007
Sold by
Benzak As Co-Executor Virginia A
Bought by
Benzak Virginia A
Purchase Details
Closed on
May 16, 2005
Sold by
Mchugh Florence Q
Bought by
Benzak Louis R and Benzak Virginia S
Purchase Details
Closed on
Oct 21, 1996
Sold by
Young William Kelly
Bought by
Mchugh Florence Q
Home Financials for this Owner
Home Financials are based on the most recent Mortgage that was taken out on this home.
Original Mortgage
$405,000
Interest Rate
8.07%
Purchase Details
Closed on
May 8, 1996
Sold by
Fleischer Barry and Weiss Arnold
Bought by
Young William Kelly
Home Financials for this Owner
Home Financials are based on the most recent Mortgage that was taken out on this home.
Original Mortgage
$621,000
Interest Rate
7.77%
Create a Home Valuation Report for This Property
The Home Valuation Report is an in-depth analysis detailing your home's value as well as a comparison with similar homes in the area
Home Values in the Area
Average Home Value in this Area
Purchase History
| Date | Buyer | Sale Price | Title Company |
|---|---|---|---|
| Virginia S Benzak Revocable Trust | -- | -- | |
| Benzak Virginia A | -- | -- | |
| Benzak Louis R | $2,295,000 | -- | |
| Mchugh Florence Q | $705,000 | -- | |
| Young William Kelly | $690,000 | -- |
Source: Public Records
Mortgage History
| Date | Status | Borrower | Loan Amount |
|---|---|---|---|
| Previous Owner | Mchugh Florence Q | $405,000 | |
| Previous Owner | Young William Kelly | $621,000 |
Source: Public Records
Tax History Compared to Growth
Tax History
| Year | Tax Paid | Tax Assessment Tax Assessment Total Assessment is a certain percentage of the fair market value that is determined by local assessors to be the total taxable value of land and additions on the property. | Land | Improvement |
|---|---|---|---|---|
| 2025 | $28,350 | $243,612 | $49,143 | $194,469 |
| 2024 | $28,350 | $226,760 | $49,143 | $177,617 |
| 2023 | $22,035 | $217,733 | $49,143 | $168,590 |
| 2022 | $21,097 | $235,513 | $49,143 | $186,370 |
| 2021 | $23,539 | $191,891 | $49,143 | $142,748 |
| 2020 | $20,338 | $212,127 | $49,143 | $162,984 |
| 2019 | $19,605 | $207,444 | $49,143 | $158,301 |
| 2018 | $22,529 | $198,077 | $49,143 | $148,934 |
| 2017 | $21,069 | $186,649 | $49,143 | $137,506 |
| 2016 | $19,972 | $183,922 | $49,143 | $134,779 |
| 2015 | $10,790 | $166,028 | $49,143 | $116,885 |
| 2014 | $10,790 | $157,279 | $49,143 | $108,136 |
Source: Public Records
Map
Nearby Homes
- 30 E 72nd St Unit 11THFL
- 28 E 72nd St
- 40 E 72nd St Unit 5
- 29 E 72nd St Unit 2
- 31 E 72nd St Unit 4B
- 31 E 72nd St Unit 7B
- 45 E 72nd St Unit 7B
- 45 E 72nd St Unit 9C
- 45 E 72nd St Unit 9BC
- 740 Park Ave Unit 67D
- 740 Park Ave Unit 2/3D
- 55 E 72nd St Unit 10S
- 55 E 72nd St Unit 11N
- 750 Park Ave Unit 9CD
- 750 Park Ave Unit 1C
- 750 Park Ave Unit 4C
- 750 Park Ave Unit 16D
- 750 Park Ave Unit 3B
- 59 E 72nd St Unit 4C
- 59 E 72nd St Unit 2A
- 50 E 72nd St Unit PHA
- 50 E 72nd St Unit 15D
- 50 E 72nd St Unit 15PHC
- 50 E 72nd St Unit 15B
- 50 E 72nd St Unit 15A
- 50 E 72nd St Unit 14A
- 50 E 72nd St Unit 13C
- 50 E 72nd St Unit 13B
- 50 E 72nd St Unit 13A
- 50 E 72nd St Unit 12C
- 50 E 72nd St Unit 12A
- 50 E 72nd St Unit 11C
- 50 E 72nd St Unit 11B
- 50 E 72nd St Unit 11A
- 50 E 72nd St Unit 10D
- 50 E 72nd St Unit 10C
- 50 E 72nd St Unit 10A
- 50 E 72nd St Unit 9D
- 50 E 72nd St Unit 9C