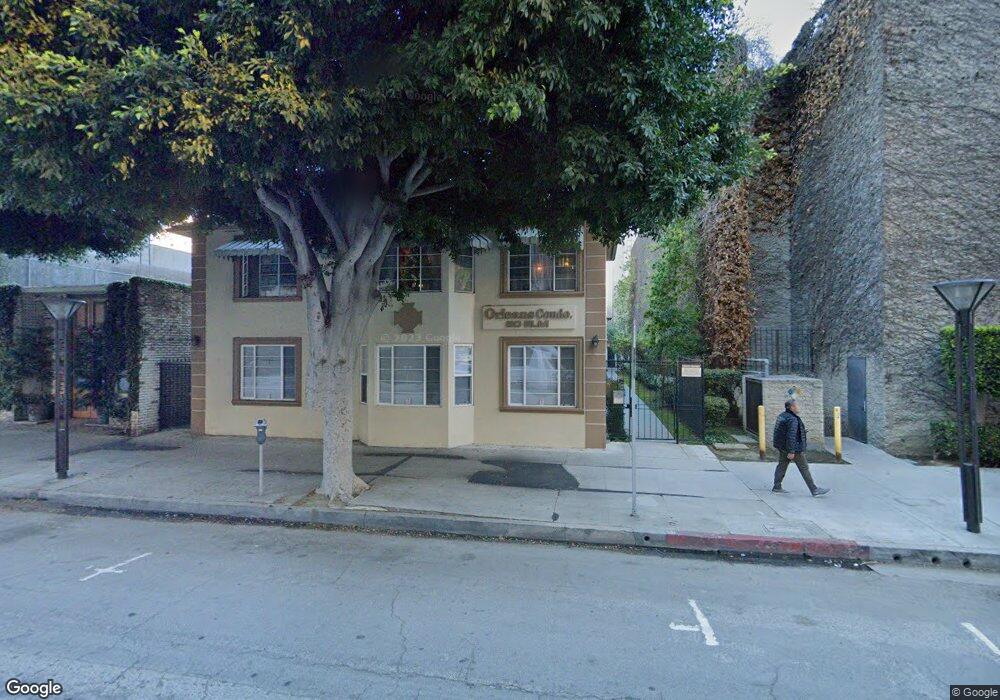
50 Elm Ave Unit 7 Long Beach, CA 90802
East Village NeighborhoodEstimated Value: $435,000 - $493,000
1
Bed
1
Bath
885
Sq Ft
$521/Sq Ft
Est. Value
About This Home
This home is located at 50 Elm Ave Unit 7, Long Beach, CA 90802 and is currently estimated at $461,474, approximately $521 per square foot. 50 Elm Ave Unit 7 is a home located in Los Angeles County with nearby schools including Stevenson Elementary School, Franklin Middle School, and Long Beach Polytechnic High School.
Ownership History
Date
Name
Owned For
Owner Type
Purchase Details
Closed on
Jan 30, 2005
Sold by
Willsie Elary John
Bought by
Willsie Sofia and Martinez Marcia
Current Estimated Value
Purchase Details
Closed on
Nov 2, 2004
Sold by
Willsie Elary John
Bought by
Orleans Condominium Assn
Purchase Details
Closed on
Jul 5, 2004
Sold by
Orleans Condominium Assn
Bought by
Willsie Elary John and Willsie Sofia
Purchase Details
Closed on
Nov 2, 1998
Sold by
Guiver Harold B
Bought by
Willsie Elary John and Willsie Sofia
Home Financials for this Owner
Home Financials are based on the most recent Mortgage that was taken out on this home.
Original Mortgage
$73,000
Interest Rate
6.78%
Mortgage Type
Seller Take Back
Purchase Details
Closed on
Sep 25, 1996
Sold by
Federal Home Loan Mortgage Corporation
Bought by
Barden William
Create a Home Valuation Report for This Property
The Home Valuation Report is an in-depth analysis detailing your home's value as well as a comparison with similar homes in the area
Home Values in the Area
Average Home Value in this Area
Purchase History
| Date | Buyer | Sale Price | Title Company |
|---|---|---|---|
| Willsie Sofia | -- | Ticor Title | |
| Orleans Condominium Assn | -- | Ticor Title | |
| Willsie Elary John | -- | Ticor Title | |
| Willsie Elary John | $79,000 | Fidelity National Title Co | |
| Barden William | $80,000 | Chicago Title Insurance Co |
Source: Public Records
Mortgage History
| Date | Status | Borrower | Loan Amount |
|---|---|---|---|
| Previous Owner | Willsie Elary John | $73,000 |
Source: Public Records
Tax History
| Year | Tax Paid | Tax Assessment Tax Assessment Total Assessment is a certain percentage of the fair market value that is determined by local assessors to be the total taxable value of land and additions on the property. | Land | Improvement |
|---|---|---|---|---|
| 2025 | $3,666 | $278,626 | $179,257 | $99,369 |
| 2024 | $3,666 | $273,164 | $175,743 | $97,421 |
| 2023 | $3,598 | $267,809 | $172,298 | $95,511 |
| 2022 | $3,379 | $262,559 | $168,920 | $93,639 |
| 2021 | $3,286 | $257,411 | $165,608 | $91,803 |
| 2019 | $3,233 | $249,778 | $160,697 | $89,081 |
| 2018 | $3,152 | $244,882 | $157,547 | $87,335 |
| 2016 | $2,898 | $235,375 | $151,430 | $83,945 |
| 2015 | $2,783 | $231,841 | $149,156 | $82,685 |
| 2014 | $2,763 | $227,301 | $146,235 | $81,066 |
Source: Public Records
Map
Nearby Homes
- 455 E Ocean Blvd
- 455 E Ocean Blvd Unit 502
- 388 E Ocean Blvd Unit 703
- 388 E Ocean Blvd Unit 1614
- 388 E Ocean Blvd Unit 501
- 488 E Ocean Blvd Unit 717
- 388 E Ocean Blvd Unit 1112
- 388 E Ocean Blvd Unit 1514
- 488 E Ocean Blvd Unit 708
- 388 E Ocean Blvd Unit 709
- 488 E Ocean Blvd Unit 418
- 388 E Ocean Blvd Unit 412
- 388 E Ocean Blvd Unit 305
- 140 Linden Ave Unit 962
- 140 Linden Ave Unit 615
- 140 Linden Ave Unit 356
- 140 Linden Ave Unit 606
- 140 Linden Ave Unit 290
- 100 Atlantic Ave Unit 1005
- 100 Atlantic Ave Unit 1012
- 50 Elm Ave
- 50 Elm Ave Unit 10
- 50 Elm Ave Unit 12
- 50 Elm Ave Unit 11
- 50 Elm Ave Unit 9
- 50 Elm Ave Unit 8
- 50 Elm Ave Unit 6
- 50 Elm Ave Unit 5
- 50 Elm Ave Unit 3
- 50 Elm Ave Unit 1
- 406 E 1st St
- 406 E 1st St Unit A
- 402 E 1st St Unit 201
- 402 E 1st St Unit 203
- 402 E 1st St
- 402 E 1st St Unit 202
- 57 Linden Ave
- 65 Linden Ave
- 35 Linden Ave Unit 205
- 35 Linden Ave Unit 408
Your Personal Tour Guide
Ask me questions while you tour the home.