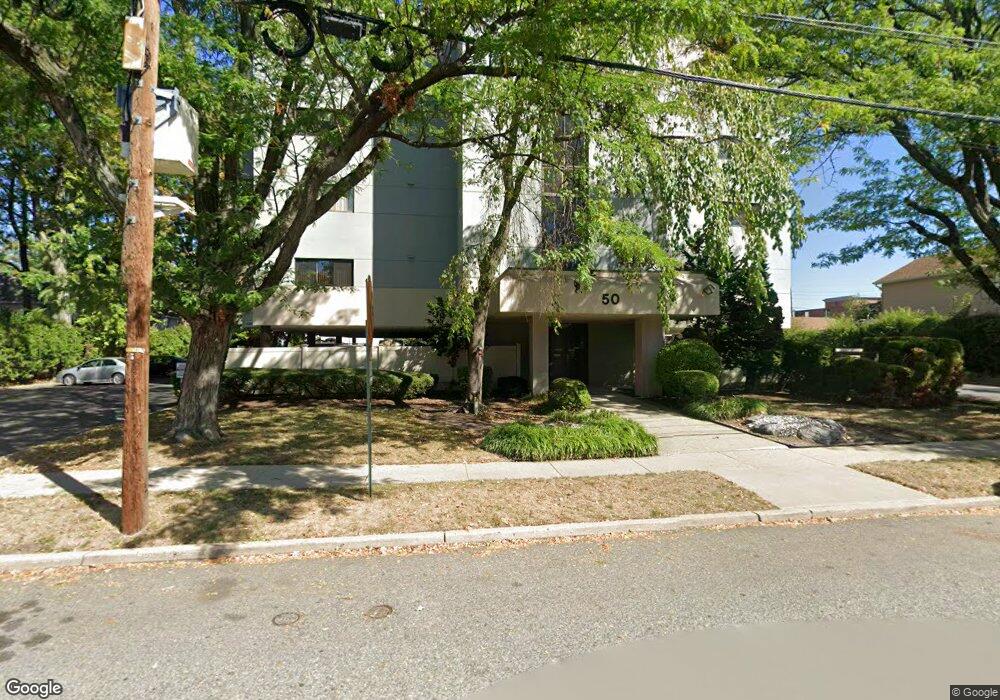
50 Euclid Ave Hackensack, NJ 07601
Estimated Value: $283,000 - $301,000
Studio
--
Bath
797
Sq Ft
$367/Sq Ft
Est. Value
About This Home
This home is located at 50 Euclid Ave, Hackensack, NJ 07601 and is currently estimated at $292,170, approximately $366 per square foot. 50 Euclid Ave is a home located in Bergen County with nearby schools including Hackensack High School, Teaneck Community Charter School, and Bergen County Christian Academy.
Ownership History
Date
Name
Owned For
Owner Type
Purchase Details
Closed on
Oct 6, 2023
Sold by
Poenaru Mariana
Bought by
Poenaru Mariana and Poenaru Stan Daniel
Current Estimated Value
Purchase Details
Closed on
Nov 23, 2022
Sold by
Chan Melissa
Bought by
Poenaru Mariana
Home Financials for this Owner
Home Financials are based on the most recent Mortgage that was taken out on this home.
Original Mortgage
$175,000
Interest Rate
6.61%
Mortgage Type
New Conventional
Purchase Details
Closed on
May 14, 2018
Sold by
Halligan Brian J
Bought by
Chan Melissa and Chan Chi K
Purchase Details
Closed on
Mar 20, 2001
Sold by
Estate Of Jacqueline Sudin
Bought by
Mcdaid Maureen T
Home Financials for this Owner
Home Financials are based on the most recent Mortgage that was taken out on this home.
Original Mortgage
$81,600
Interest Rate
6.9%
Create a Home Valuation Report for This Property
The Home Valuation Report is an in-depth analysis detailing your home's value as well as a comparison with similar homes in the area
Home Values in the Area
Average Home Value in this Area
Purchase History
| Date | Buyer | Sale Price | Title Company |
|---|---|---|---|
| Poenaru Mariana | -- | American Land Title | |
| Poenaru Mariana | -- | American Land Title | |
| Poenaru Mariana | $245,000 | Carnegie Title | |
| Poenaru Mariana | $245,000 | Carnegie Title | |
| Chan Melissa | $169,900 | -- | |
| Mcdaid Maureen T | $102,000 | -- |
Source: Public Records
Mortgage History
| Date | Status | Borrower | Loan Amount |
|---|---|---|---|
| Previous Owner | Poenaru Mariana | $175,000 | |
| Previous Owner | Mcdaid Maureen T | $81,600 |
Source: Public Records
Tax History
| Year | Tax Paid | Tax Assessment Tax Assessment Total Assessment is a certain percentage of the fair market value that is determined by local assessors to be the total taxable value of land and additions on the property. | Land | Improvement |
|---|---|---|---|---|
| 2025 | $5,993 | $196,100 | $105,000 | $91,100 |
| 2024 | $5,646 | $196,100 | $105,000 | $91,100 |
| 2023 | $5,352 | $196,100 | $105,000 | $91,100 |
| 2022 | $5,352 | $191,000 | $100,000 | $91,000 |
| 2021 | $5,390 | $160,500 | $87,500 | $73,000 |
| 2020 | $5,311 | $160,500 | $87,500 | $73,000 |
| 2019 | $5,344 | $159,200 | $87,000 | $72,200 |
| 2018 | $5,410 | $158,500 | $86,500 | $72,000 |
| 2017 | $5,334 | $156,200 | $85,000 | $71,200 |
| 2016 | $5,246 | $155,300 | $85,000 | $70,300 |
| 2015 | $5,271 | $150,600 | $49,700 | $100,900 |
| 2014 | $5,003 | $150,600 | $49,700 | $100,900 |
Source: Public Records
Map
Nearby Homes
- 55 Clinton Place Unit 502
- 208 Anderson St Unit S5A
- 208 Anderson St Unit S4F
- 208 Anderson St Unit 7SG
- 26 van Orden Place
- 433 Park St
- 140 Euclid Ave Unit 6E
- 140 Euclid Ave Unit 1G
- 5 Linden St Unit 3C
- 31 Fairmount Ave
- 30 Clarendon Place
- 150 Grand Ave Unit 1A
- 290 Anderson St Unit 5D
- 290 Anderson St Unit 2A
- 363 Park St
- 395 2nd St
- 300 Lookout Ave Unit C4
- 81 Fairmount Ave
- 252 Berry St
- 297 Hamilton Place
Your Personal Tour Guide
Ask me questions while you tour the home.