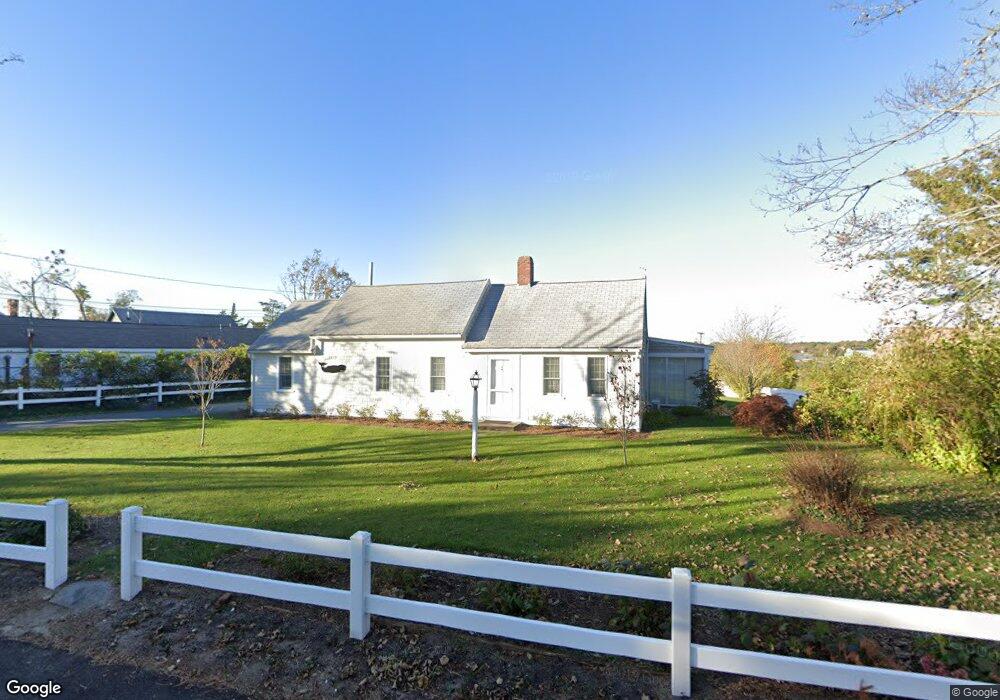
50 Ferry St West Dennis, MA 02670
West Dennis NeighborhoodEstimated Value: $439,000 - $683,000
2
Beds
1
Bath
1,052
Sq Ft
$527/Sq Ft
Est. Value
About This Home
This home is located at 50 Ferry St, West Dennis, MA 02670 and is currently estimated at $553,997, approximately $526 per square foot. 50 Ferry St is a home located in Barnstable County with nearby schools including Dennis-Yarmouth Regional High School and St. Pius X. School.
Ownership History
Date
Name
Owned For
Owner Type
Purchase Details
Closed on
Aug 20, 2013
Sold by
Ewing 2Nd Arthur W
Bought by
Riebold Shawn
Current Estimated Value
Home Financials for this Owner
Home Financials are based on the most recent Mortgage that was taken out on this home.
Original Mortgage
$227,000
Outstanding Balance
$168,271
Interest Rate
4.31%
Mortgage Type
New Conventional
Estimated Equity
$385,726
Create a Home Valuation Report for This Property
The Home Valuation Report is an in-depth analysis detailing your home's value as well as a comparison with similar homes in the area
Home Values in the Area
Average Home Value in this Area
Purchase History
| Date | Buyer | Sale Price | Title Company |
|---|---|---|---|
| Riebold Shawn | $227,000 | -- |
Source: Public Records
Mortgage History
| Date | Status | Borrower | Loan Amount |
|---|---|---|---|
| Open | Riebold Shawn | $227,000 |
Source: Public Records
Tax History Compared to Growth
Tax History
| Year | Tax Paid | Tax Assessment Tax Assessment Total Assessment is a certain percentage of the fair market value that is determined by local assessors to be the total taxable value of land and additions on the property. | Land | Improvement |
|---|---|---|---|---|
| 2025 | $1,664 | $384,400 | $156,800 | $227,600 |
| 2024 | $1,571 | $357,800 | $150,800 | $207,000 |
| 2023 | $1,521 | $325,800 | $137,100 | $188,700 |
| 2022 | $1,544 | $275,800 | $135,900 | $139,900 |
| 2021 | $6,843 | $257,400 | $133,200 | $124,200 |
| 2020 | $1,635 | $268,100 | $145,300 | $122,800 |
| 2019 | $1,607 | $250,000 | $118,700 | $131,300 |
| 2018 | $4,864 | $283,700 | $169,500 | $114,200 |
| 2017 | $1,682 | $253,400 | $135,600 | $117,800 |
| 2016 | $1,647 | $252,200 | $152,600 | $99,600 |
| 2015 | $1,614 | $252,200 | $152,600 | $99,600 |
| 2014 | $1,621 | $255,300 | $152,600 | $102,700 |
Source: Public Records
Map
Nearby Homes
- 45 Seth Ln
- 40 Kelley Rd
- 209 Main St Unit 3
- 209 Main St Unit 6
- 209 Main St Unit 1
- 209 Main St Unit 2
- 209 Main St Unit 4
- 209 Main St Unit 5
- 308 Old Main St
- 14 Schoolhouse Ln
- 29 Bass River Rd
- 18 Turner Ln
- 23 Doric Ave
- 2 Rita Mary Way
- 116 N Main St
- 15 Sharon Rd
- 22 Powhatan Rd
- 401 Main St Unit 201
- 401 Main St Unit 101
- 7 Sunset Pines Rd