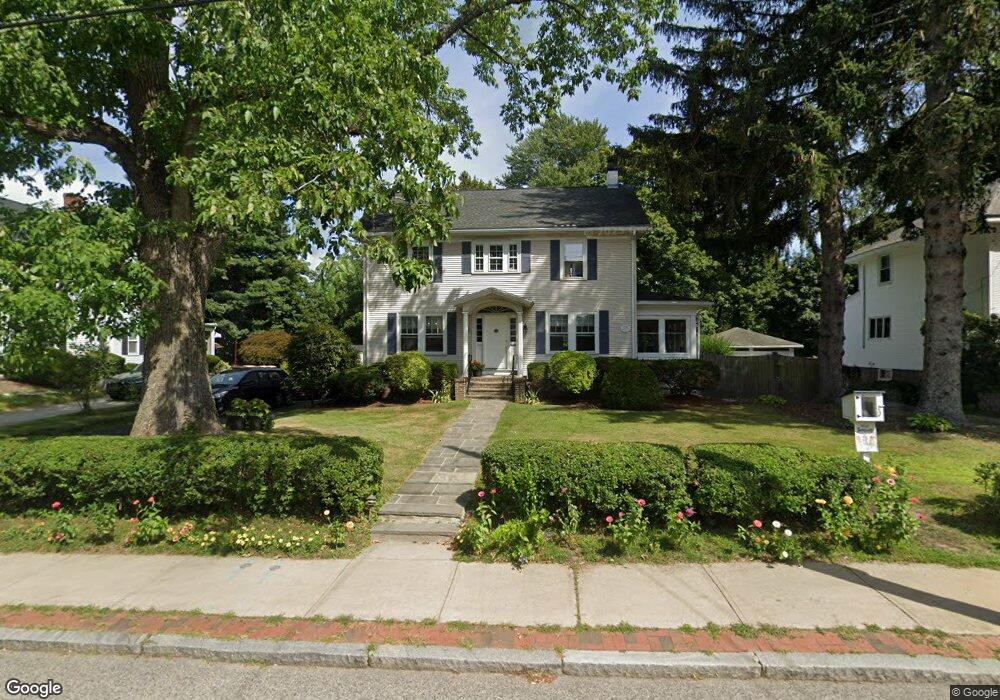
50 Front St Weymouth, MA 02188
Weymouth Landing NeighborhoodEstimated Value: $660,058 - $740,000
3
Beds
2
Baths
1,846
Sq Ft
$374/Sq Ft
Est. Value
About This Home
This home is located at 50 Front St, Weymouth, MA 02188 and is currently estimated at $689,765, approximately $373 per square foot. 50 Front St is a home located in Norfolk County with nearby schools including Frederick C Murphy, Abigail Adams Middle School, and Weymouth Middle School Chapman.
Ownership History
Date
Name
Owned For
Owner Type
Purchase Details
Closed on
Jun 4, 1993
Sold by
Whitney E Biden and Whitney Virginia W
Bought by
Dumont Dennis L and Dumont Eileen E
Current Estimated Value
Home Financials for this Owner
Home Financials are based on the most recent Mortgage that was taken out on this home.
Original Mortgage
$152,000
Interest Rate
7.33%
Mortgage Type
Purchase Money Mortgage
Create a Home Valuation Report for This Property
The Home Valuation Report is an in-depth analysis detailing your home's value as well as a comparison with similar homes in the area
Home Values in the Area
Average Home Value in this Area
Purchase History
| Date | Buyer | Sale Price | Title Company |
|---|---|---|---|
| Dumont Dennis L | $160,000 | -- |
Source: Public Records
Mortgage History
| Date | Status | Borrower | Loan Amount |
|---|---|---|---|
| Open | Dumont Dennis L | $160,000 | |
| Closed | Dumont Dennis L | $152,000 |
Source: Public Records
Tax History Compared to Growth
Tax History
| Year | Tax Paid | Tax Assessment Tax Assessment Total Assessment is a certain percentage of the fair market value that is determined by local assessors to be the total taxable value of land and additions on the property. | Land | Improvement |
|---|---|---|---|---|
| 2025 | $5,653 | $559,700 | $204,500 | $355,200 |
| 2024 | $5,479 | $533,500 | $194,800 | $338,700 |
| 2023 | $5,455 | $522,000 | $180,400 | $341,600 |
| 2022 | $5,298 | $462,300 | $167,000 | $295,300 |
| 2021 | $4,953 | $421,900 | $167,000 | $254,900 |
| 2020 | $4,724 | $396,300 | $167,000 | $229,300 |
| 2019 | $4,609 | $380,300 | $160,600 | $219,700 |
| 2018 | $4,463 | $357,000 | $153,000 | $204,000 |
| 2017 | $4,171 | $325,600 | $145,700 | $179,900 |
| 2016 | $4,008 | $313,100 | $140,100 | $173,000 |
| 2015 | $3,844 | $298,000 | $140,100 | $157,900 |
| 2014 | $3,687 | $277,200 | $130,400 | $146,800 |
Source: Public Records
Map
Nearby Homes
- 122 Washington St Unit 22
- 36 Brookside Rd
- 11 Richmond St
- 37 Lantern Ln
- 23-25 Lindbergh Ave
- 114 Broad St Unit D
- 114 Broad St Unit C
- 141 Commercial St Unit 9
- 15 Summer St
- 16 Lindbergh Ave
- 19 Vine St Unit 3
- 19 Vine St Unit 1
- 51 Faxon St
- 76 Kingman St
- 294 Commercial St
- 97 Liberty St
- 685 Union St
- 33 Congress St
- 24 Blake Rd
- 48 Apple Tree Ln