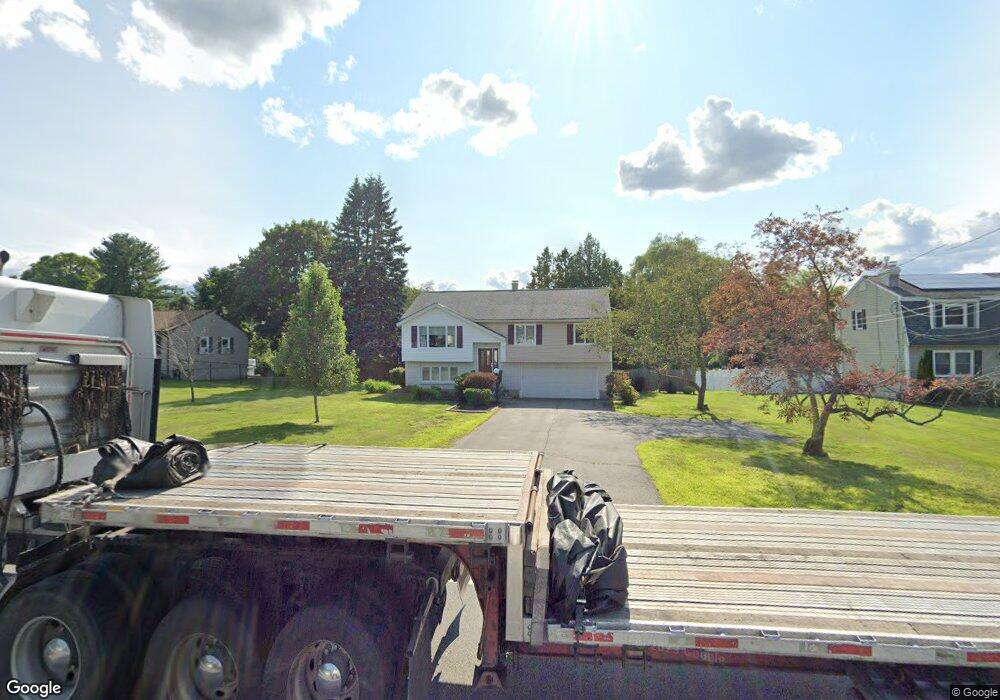
50 Hampstead St Methuen, MA 01844
The North End NeighborhoodEstimated Value: $604,000 - $668,000
3
Beds
2
Baths
1,710
Sq Ft
$370/Sq Ft
Est. Value
About This Home
This home is located at 50 Hampstead St, Methuen, MA 01844 and is currently estimated at $632,807, approximately $370 per square foot. 50 Hampstead St is a home located in Essex County with nearby schools including Methuen High School and The Birches Academy of Academics and Art.
Ownership History
Date
Name
Owned For
Owner Type
Purchase Details
Closed on
Jul 23, 2021
Sold by
Mohamed Nadia and Ciardello John A
Bought by
Clardello T T and Clardello C
Current Estimated Value
Purchase Details
Closed on
May 26, 2017
Sold by
Vallario Ft and Vallario
Bought by
Mohamed Nadia and Ciardello John A
Home Financials for this Owner
Home Financials are based on the most recent Mortgage that was taken out on this home.
Original Mortgage
$324,022
Interest Rate
4.25%
Mortgage Type
FHA
Purchase Details
Closed on
Aug 8, 2016
Sold by
Vallario Andrew R
Bought by
Vallario Ft and Vallario
Purchase Details
Closed on
Sep 30, 1999
Sold by
Kendra Thomas R and Hartnett Lisa
Bought by
Vallario Marie
Purchase Details
Closed on
May 6, 1991
Sold by
Andrews Maryann M
Bought by
Kendra Thomas R
Purchase Details
Closed on
Dec 23, 1987
Sold by
Ryan Daniel J
Bought by
Ryan Maryann M
Create a Home Valuation Report for This Property
The Home Valuation Report is an in-depth analysis detailing your home's value as well as a comparison with similar homes in the area
Home Values in the Area
Average Home Value in this Area
Purchase History
| Date | Buyer | Sale Price | Title Company |
|---|---|---|---|
| Clardello T T | -- | None Available | |
| Clardello T T | -- | None Available | |
| Clardello T T | -- | None Available | |
| Mohamed Nadia | $330,000 | -- | |
| Vallario Ft | -- | -- | |
| Vallario Ft | -- | -- | |
| Vallario Ft | -- | -- | |
| Vallario Marie | $209,900 | -- | |
| Vallario Marie | $209,900 | -- | |
| Kendra Thomas R | $137,000 | -- | |
| Kendra Thomas R | $137,000 | -- | |
| Ryan Maryann M | $20,000 | -- |
Source: Public Records
Mortgage History
| Date | Status | Borrower | Loan Amount |
|---|---|---|---|
| Previous Owner | Mohamed Nadia | $324,022 | |
| Previous Owner | Ryan Maryann M | $75,000 |
Source: Public Records
Tax History
| Year | Tax Paid | Tax Assessment Tax Assessment Total Assessment is a certain percentage of the fair market value that is determined by local assessors to be the total taxable value of land and additions on the property. | Land | Improvement |
|---|---|---|---|---|
| 2025 | $5,798 | $548,000 | $236,800 | $311,200 |
| 2024 | $5,808 | $534,800 | $216,000 | $318,800 |
| 2023 | $5,467 | $467,300 | $192,000 | $275,300 |
| 2022 | $5,255 | $402,700 | $160,000 | $242,700 |
| 2021 | $4,991 | $378,400 | $152,000 | $226,400 |
| 2020 | $4,954 | $368,600 | $152,000 | $216,600 |
| 2019 | $4,720 | $332,600 | $136,000 | $196,600 |
| 2018 | $4,419 | $309,700 | $136,000 | $173,700 |
| 2017 | $4,103 | $280,100 | $136,000 | $144,100 |
| 2016 | $3,936 | $265,800 | $128,000 | $137,800 |
| 2015 | $3,834 | $262,600 | $128,000 | $134,600 |
Source: Public Records
Map
Nearby Homes
- 11 Brookside Ct
- 7 Tree Top Way
- 159-161 Howe St
- 3 Adams Ave
- 139 North St
- 55 Phoebe St Unit 32
- 40 Phoebe St Unit 101
- 127 Phoebe St Unit 127
- 125 Phoebe St Unit 125
- 28 Currier Ave
- 64-66 Howe St
- 18 Shepard Ave
- 20 Williams St
- 64 Pine Tree Dr Unit 64
- 47 Bailey Ct
- Lot 108 Garden City Rd
- 2 Sequoia Dr Unit 2
- 8 Ridgeview Ave
- 25 Carol Ave
- 74 Ayers Village Rd
- 52 Hampstead St
- 48 Hampstead St
- 46 Hampstead St
- 54 Hampstead St
- 43 Hampstead St
- 12 Coachman Ln
- 45 Hampstead St
- 14 Coachman Ln
- 56 Hampstead St
- 44 Hampstead St
- 47 Hampstead St
- 3 Old Homestead Rd
- 41A Hampstead St
- 110 Maple St
- 41 Hampstead St
- 114 Maple St
- 9 Coachman Ln
- 55 Hampstead St
- 11 Coachman Ln
- 118 Maple St
Your Personal Tour Guide
Ask me questions while you tour the home.