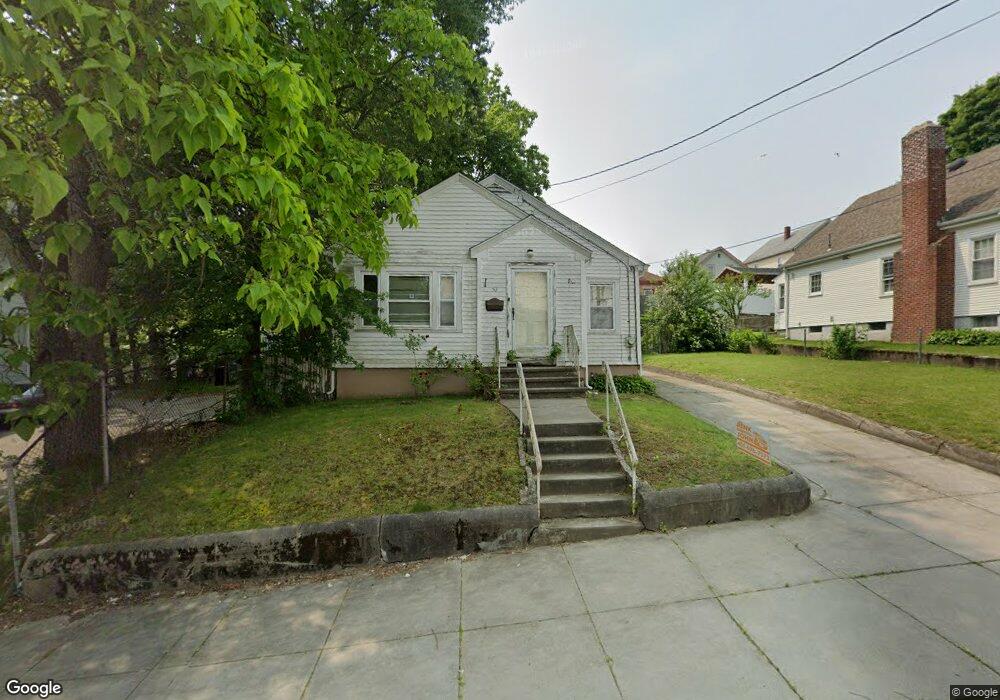
50 Hendrick St Providence, RI 02908
Mount Pleasant NeighborhoodEstimated Value: $199,000 - $295,680
2
Beds
1
Bath
920
Sq Ft
$267/Sq Ft
Est. Value
About This Home
This home is located at 50 Hendrick St, Providence, RI 02908 and is currently estimated at $245,670, approximately $267 per square foot. 50 Hendrick St is a home located in Providence County with nearby schools including Asa Messer Elementary School, Charles N. Fortes Elementary School, and Laurel Hill Annex School.
Ownership History
Date
Name
Owned For
Owner Type
Purchase Details
Closed on
Jul 22, 2025
Sold by
Robinson Margaret L Est and Robinson
Bought by
Acb Group Llc
Current Estimated Value
Purchase Details
Closed on
Jan 15, 2010
Sold by
Department Of Housing & Urban Dev
Bought by
Robinson Margaret L
Purchase Details
Closed on
Oct 13, 2009
Sold by
Everbank
Bought by
Department Of Housing & Urban Dev
Purchase Details
Closed on
Jul 19, 2005
Sold by
Torres Jose
Bought by
Reyes Emerson D and Reyes Patricia
Home Financials for this Owner
Home Financials are based on the most recent Mortgage that was taken out on this home.
Original Mortgage
$198,000
Interest Rate
5.67%
Mortgage Type
Purchase Money Mortgage
Purchase Details
Closed on
Sep 17, 2003
Sold by
Morton Sandra M Est and Morton-Callahan
Bought by
Torres Jose
Purchase Details
Closed on
May 27, 1993
Sold by
Union Deposit Ln & Inv
Bought by
Morton Sandra M
Create a Home Valuation Report for This Property
The Home Valuation Report is an in-depth analysis detailing your home's value as well as a comparison with similar homes in the area
Home Values in the Area
Average Home Value in this Area
Purchase History
| Date | Buyer | Sale Price | Title Company |
|---|---|---|---|
| Acb Group Llc | $200,000 | -- | |
| Acb Group Llc | $200,000 | -- | |
| Acb Group Llc | $200,000 | -- | |
| Robinson Margaret L | $65,509 | -- | |
| Robinson Margaret L | $65,509 | -- | |
| Department Of Housing & Urban Dev | -- | -- | |
| Department Of Housing & Urban Dev | -- | -- | |
| Reyes Emerson D | $198,000 | -- | |
| Reyes Emerson D | $198,000 | -- | |
| Torres Jose | $135,000 | -- | |
| Torres Jose | $135,000 | -- | |
| Morton Sandra M | $50,000 | -- | |
| Morton Sandra M | $50,000 | -- |
Source: Public Records
Mortgage History
| Date | Status | Borrower | Loan Amount |
|---|---|---|---|
| Previous Owner | Morton Sandra M | $226,345 | |
| Previous Owner | Morton Sandra M | $198,000 |
Source: Public Records
Tax History Compared to Growth
Tax History
| Year | Tax Paid | Tax Assessment Tax Assessment Total Assessment is a certain percentage of the fair market value that is determined by local assessors to be the total taxable value of land and additions on the property. | Land | Improvement |
|---|---|---|---|---|
| 2025 | $3,983 | $272,800 | $114,400 | $158,400 |
| 2024 | $3,786 | $206,300 | $69,400 | $136,900 |
| 2023 | $3,786 | $206,300 | $69,400 | $136,900 |
| 2022 | $3,672 | $206,300 | $69,400 | $136,900 |
| 2021 | $3,539 | $144,100 | $49,200 | $94,900 |
| 2020 | $3,539 | $144,100 | $49,200 | $94,900 |
| 2019 | $3,539 | $144,100 | $49,200 | $94,900 |
| 2018 | $3,174 | $99,300 | $38,700 | $60,600 |
| 2017 | $3,174 | $99,300 | $38,700 | $60,600 |
| 2016 | $3,174 | $99,300 | $38,700 | $60,600 |
| 2015 | $3,340 | $100,900 | $47,700 | $53,200 |
| 2014 | $3,405 | $100,900 | $47,700 | $53,200 |
| 2013 | $3,405 | $100,900 | $47,700 | $53,200 |
Source: Public Records
Map
Nearby Homes
- 58 Hendrick St
- 42 Hendrick St
- 57 Armington Ave
- 53 Armington Ave
- 60 Hendrick St
- 61 Armington Ave
- 41 Hendrick St
- 49 Hendrick St
- 51 Hendrick St
- 65 Armington Ave
- 57 Hendrick St
- 64 Hendrick St
- 36 Hendrick St
- 69 Armington Ave
- 37 Armington Ave
- 65 Hendrick St
- 65 Hendrick St Unit 3
- 65 Hendrick St Unit 2
- 65 Hendrick St Unit 1
- 75 Armington Ave