
Seller's Agent in 2025
Douglas Nahigian
Douglas Elliman Real Estate - Wellesley
(508) 648-4997
1 in this area
17 Total Sales


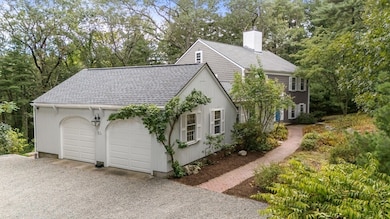


Welcome to this beautiful Royal Barry Wills Colonial in a highly sought-after South Side location with 4 bedrooms and 3.5 baths sitting on over 2 acres of mature landscaping, abutting conservation and walking trails. The large living room with fireplace, crown molding, and large windows overlooks serene wooded views. The dining room opens to a screened porch and brick terrace, perfect for indoor-outdoor entertaining. The office has wood beams, fireplace and numerous built ins. The updated kitchen features stainless steel appliances, Sub-Zero refrigerator, quartz countertops & new backsplash. A cathedral-ceiling family room with beams, wood stove, and updated 1/2 bath completes the first level. Upstairs, the generous primary suite has custom moldings and ensuite bath, with three additional bedrooms and a hall bath. The walk-out lower level offers built-ins, fireplace, custom cabinets, full bath, and laundry. Near major routes, public transit & top-rated schools. Offers due 9/13 by 6PM
Last Agent to Sell the Property
Douglas Elliman Real Estate - Wellesley Listed on: 09/10/2025
| Date | Type | Sale Price | Title Company |
|---|---|---|---|
| Deed | $2,100,000 | -- | |
| Quit Claim Deed | -- | None Available | |
| Quit Claim Deed | -- | None Available | |
| Deed | -- | -- | |
| Deed | -- | -- | |
| Deed | -- | -- |
| Date | Status | Loan Amount | Loan Type |
|---|---|---|---|
| Open | $4,397,500 | Purchase Money Mortgage | |
| Previous Owner | $150,000 | No Value Available | |
| Previous Owner | $45,000 | No Value Available |
| Date | Event | Price | List to Sale | Price per Sq Ft |
|---|---|---|---|---|
| 10/15/2025 10/15/25 | Sold | $2,100,000 | +17.0% | $652 / Sq Ft |
| 09/14/2025 09/14/25 | Pending | -- | -- | -- |
| 09/10/2025 09/10/25 | For Sale | $1,795,000 | -- | $557 / Sq Ft |
| Year | Tax Paid | Tax Assessment Tax Assessment Total Assessment is a certain percentage of the fair market value that is determined by local assessors to be the total taxable value of land and additions on the property. | Land | Improvement |
|---|---|---|---|---|
| 2025 | $17,767 | $1,600,600 | $1,016,900 | $583,700 |
| 2024 | $17,508 | $1,574,500 | $1,016,900 | $557,600 |
| 2023 | $17,787 | $1,502,300 | $1,016,900 | $485,400 |
| 2022 | $17,744 | $1,385,200 | $969,300 | $415,900 |
| 2021 | $17,112 | $1,318,300 | $921,900 | $396,400 |
| 2020 | $16,575 | $1,291,900 | $921,900 | $370,000 |
| 2019 | $16,215 | $1,287,900 | $921,900 | $366,000 |
| 2018 | $16,090 | $1,286,200 | $921,900 | $364,300 |
| 2017 | $15,949 | $1,286,200 | $921,900 | $364,300 |
| 2016 | $15,640 | $1,286,200 | $921,900 | $364,300 |
| 2015 | $15,158 | $1,234,400 | $880,500 | $353,900 |
Seller's Agent in 2025
Douglas Nahigian
Douglas Elliman Real Estate - Wellesley
(508) 648-4997
1 in this area
17 Total Sales
C
Buyer's Agent in 2025
Chaplin Partners
Compass
(617) 206-3333
62 in this area
76 Total Sales
Source: MLS Property Information Network (MLS PIN)
MLS Number: 73428829
APN: WEST-000057-000073
Disclaimer: Certain information contained herein is derived from information provided by parties other than Homes.com. All information provided is deemed reliable, but is not guaranteed to be accurate and should be independently verified.
![]() The property listing data and information, or the Images, set forth herein were provided to MLS Property Information Network, Inc. from third party sources, including sellers, lessors and public records, and were compiled by MLS Property Information Network, Inc. The property listing data and information, and the Images, are for the personal, non-commercial use of consumers having a good faith interest in purchasing or leasing listed properties of the type displayed to them and may not be used for any purpose other than to identify prospective properties which such consumers may have a good faith interest in purchasing or leasing. MLS Property Information Network, Inc. and its subscribers disclaim any and all representations and warranties as to the accuracy of the property listing data and information, or as to the accuracy of any of the Images, set forth herein.
The property listing data and information, or the Images, set forth herein were provided to MLS Property Information Network, Inc. from third party sources, including sellers, lessors and public records, and were compiled by MLS Property Information Network, Inc. The property listing data and information, and the Images, are for the personal, non-commercial use of consumers having a good faith interest in purchasing or leasing listed properties of the type displayed to them and may not be used for any purpose other than to identify prospective properties which such consumers may have a good faith interest in purchasing or leasing. MLS Property Information Network, Inc. and its subscribers disclaim any and all representations and warranties as to the accuracy of the property listing data and information, or as to the accuracy of any of the Images, set forth herein.