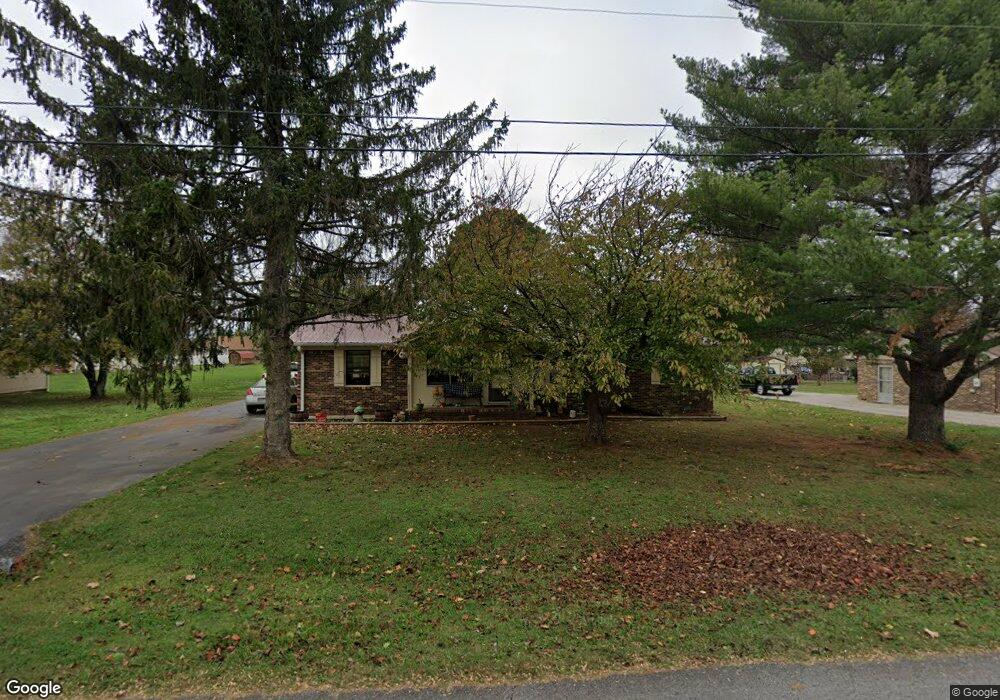
50 Lakeland Ct Winchester, TN 37398
Estimated Value: $173,311 - $210,000
--
Bed
1
Bath
1,050
Sq Ft
$181/Sq Ft
Est. Value
About This Home
This home is located at 50 Lakeland Ct, Winchester, TN 37398 and is currently estimated at $190,328, approximately $181 per square foot. 50 Lakeland Ct is a home located in Franklin County with nearby schools including South Middle School, Franklin County High School, and Winchester Christian Academy.
Ownership History
Date
Name
Owned For
Owner Type
Purchase Details
Closed on
Dec 14, 2022
Sold by
Mann Family Revocable Trust
Bought by
Kiebach Barbara Alice and Kiebach Nicholas
Current Estimated Value
Home Financials for this Owner
Home Financials are based on the most recent Mortgage that was taken out on this home.
Original Mortgage
$161,912
Outstanding Balance
$156,475
Interest Rate
6.33%
Estimated Equity
$33,853
Purchase Details
Closed on
Feb 1, 2021
Sold by
Mann Troy P
Bought by
Snyder Mary and Mann Family Revocable Trust
Purchase Details
Closed on
Dec 4, 2015
Sold by
Mann Troy P
Bought by
Mann Troy P and Mann Dorothy
Purchase Details
Closed on
Mar 12, 1999
Sold by
Tucker Dorothy R
Bought by
Mann Troy P
Purchase Details
Closed on
May 10, 1983
Bought by
Tucker Dorothy R
Purchase Details
Closed on
Jul 1, 1982
Purchase Details
Closed on
Apr 22, 1981
Purchase Details
Closed on
Feb 22, 1979
Create a Home Valuation Report for This Property
The Home Valuation Report is an in-depth analysis detailing your home's value as well as a comparison with similar homes in the area
Home Values in the Area
Average Home Value in this Area
Purchase History
| Date | Buyer | Sale Price | Title Company |
|---|---|---|---|
| Kiebach Barbara Alice | $164,900 | Access Title & Escrow | |
| Snyder Mary | -- | Access Title & Escrow Inc | |
| Mann Troy P | -- | -- | |
| Mann Troy P | -- | -- | |
| Tucker Dorothy R | -- | -- | |
| -- | -- | -- | |
| -- | -- | -- | |
| -- | -- | -- |
Source: Public Records
Mortgage History
| Date | Status | Borrower | Loan Amount |
|---|---|---|---|
| Open | Kiebach Barbara Alice | $161,912 |
Source: Public Records
Tax History Compared to Growth
Tax History
| Year | Tax Paid | Tax Assessment Tax Assessment Total Assessment is a certain percentage of the fair market value that is determined by local assessors to be the total taxable value of land and additions on the property. | Land | Improvement |
|---|---|---|---|---|
| 2024 | $923 | $35,900 | $3,800 | $32,100 |
| 2023 | $923 | $35,900 | $3,800 | $32,100 |
| 2022 | $905 | $35,900 | $3,800 | $32,100 |
| 2021 | $557 | $35,900 | $3,800 | $32,100 |
| 2020 | $769 | $21,750 | $2,625 | $19,125 |
| 2019 | $769 | $21,750 | $2,625 | $19,125 |
| 2018 | $724 | $21,750 | $2,625 | $19,125 |
| 2017 | $724 | $21,750 | $2,625 | $19,125 |
| 2016 | $651 | $19,550 | $2,200 | $17,350 |
| 2015 | $639 | $19,550 | $2,200 | $17,350 |
| 2014 | $638 | $19,533 | $0 | $0 |
Source: Public Records
Map
Nearby Homes
- 6026 Lynchburg Rd
- 974 Lynchburg Rd
- 0 Sherry St
- 58 Island Way
- 1 Campfire Ct
- 139 Sherry St
- 0 Driftwood Ct Unit RTC2985981
- 0 Driftwood Ct Unit RTC2819097
- 159 Canoe Ct
- 407 Girton St
- 443 Canoe Ct
- 105 Island Way
- 146 Island Way
- 319 Campfire Ct
- 316 Campfire Ct
- 65 Pontoon Place
- 50 Pontoon Place
- 20 Windjammer Ct
- 346 Campfire Ct
- 407 Style St
- 32 Lakeland Ct
- 70 Lakeland Ct
- 49 Lakeland Ct
- 72 Duncan Ln
- 31 Lakeland Ct
- 95 Lakeland Ct
- 78 Lakeland Ct
- 52 Duncan Ln
- 132 Duncan Ln
- 94 Lakeland Ct
- 115 Brookfield Cir
- 85 Brookfield Cir
- 77 Duncan Ln
- 171 Lakeland Ct
- 131 Brookfield Cir
- 115 Lakeland Ct
- 191 Lakeland Ct
- 34 Duncan Ln
- 101 Brookfield Cir
- 95 Duncan Ln