Estimated Value: $705,000 - $944,090
3
Beds
3
Baths
2,775
Sq Ft
$301/Sq Ft
Est. Value
About This Home
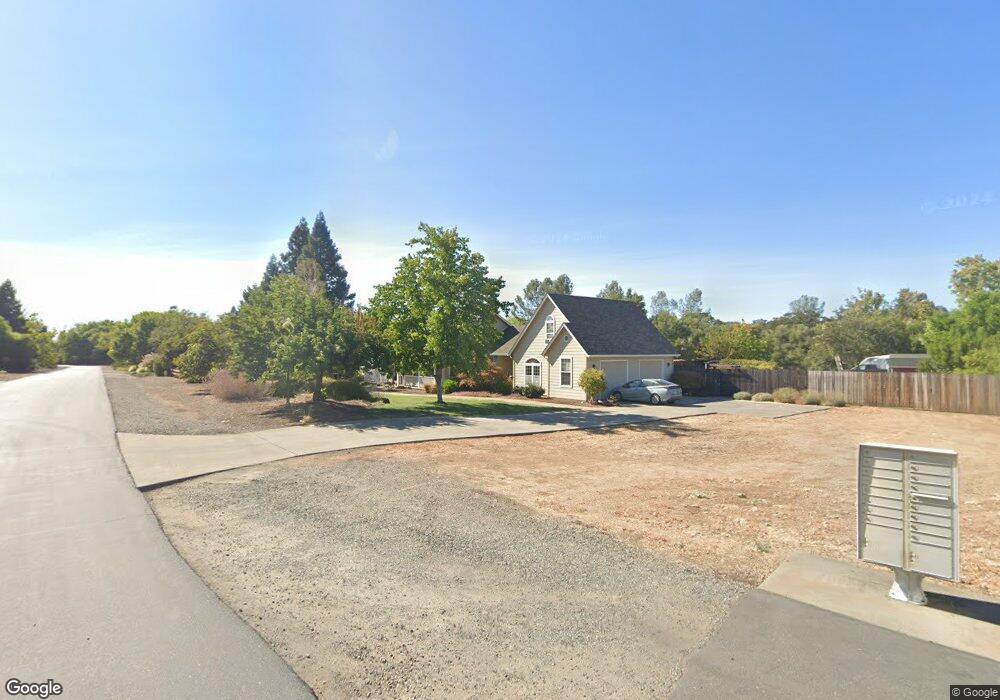
This home is located at 50 Lazy s Ln, Chico, CA 95928 and is currently estimated at $834,023, approximately $300 per square foot. 50 Lazy s Ln is a home located in Butte County with nearby schools including Little Chico Creek Elementary School, Harry M. Marsh Junior High School, and Chico High School.
Ownership History
Date
Name
Owned For
Owner Type
Purchase Details
Closed on
Oct 22, 2014
Sold by
Mullen John E and Mullen Kristy R
Bought by
Mullen 2014 Family Trust
Current Estimated Value
Purchase Details
Closed on
Feb 26, 1998
Sold by
Meyer Wayne E and Meyer Laura J
Bought by
Mullen John E and Mullen Kristy R
Create a Home Valuation Report for This Property
The Home Valuation Report is an in-depth analysis detailing your home's value as well as a comparison with similar homes in the area
Home Values in the Area
Average Home Value in this Area
Purchase History
| Date | Buyer | Sale Price | Title Company |
|---|---|---|---|
| Mullen 2014 Family Trust | -- | None Available | |
| Mullen John E | $80,000 | Mid Valley Title & Escrow Co |
Source: Public Records
Tax History Compared to Growth
Tax History
| Year | Tax Paid | Tax Assessment Tax Assessment Total Assessment is a certain percentage of the fair market value that is determined by local assessors to be the total taxable value of land and additions on the property. | Land | Improvement |
|---|---|---|---|---|
| 2025 | $6,120 | $571,497 | $135,260 | $436,237 |
| 2024 | $6,120 | $560,292 | $132,608 | $427,684 |
| 2023 | $6,044 | $549,307 | $130,008 | $419,299 |
| 2022 | $5,945 | $538,537 | $127,459 | $411,078 |
| 2021 | $5,831 | $527,978 | $124,960 | $403,018 |
| 2020 | $5,814 | $522,565 | $123,679 | $398,886 |
| 2019 | $5,707 | $512,319 | $121,254 | $391,065 |
| 2018 | $5,601 | $502,275 | $118,877 | $383,398 |
| 2017 | $5,486 | $492,428 | $116,547 | $375,881 |
| 2016 | $5,005 | $482,773 | $114,262 | $368,511 |
| 2015 | -- | $475,522 | $112,546 | $362,976 |
| 2014 | -- | $466,208 | $110,342 | $355,866 |
Source: Public Records
Map
Nearby Homes
- 0 Coyote Way Unit SN25050197
- 664 Stilson Canyon Rd
- 1982 Dawncrest Dr
- 0 Stilson Canyon Rd Unit SN24199304
- 297 Saint Augustine Dr
- 2969 Wingfield Ave
- 2886 Wingfield Ave
- 2865 Beaumont Ave
- 1147 Lentil Way
- 1110 Shumard Oak Way
- 1783 Roth St
- 2851 Pin Oak Ln
- 2234 Hutchinson St
- 129 Benson Terrace
- 0 Bruce Rd Unit SN25051893
- 0 Bruce Rd Unit SN25051885
- 121 Wawona Place
- 9 Coolwater Commons
- 5 Ginger Ln
- 0 Yosemite Dr