50 Main St Montague, MA 01351
Estimated Value: $459,000 - $594,000
7
Beds
2
Baths
2,847
Sq Ft
$184/Sq Ft
Est. Value
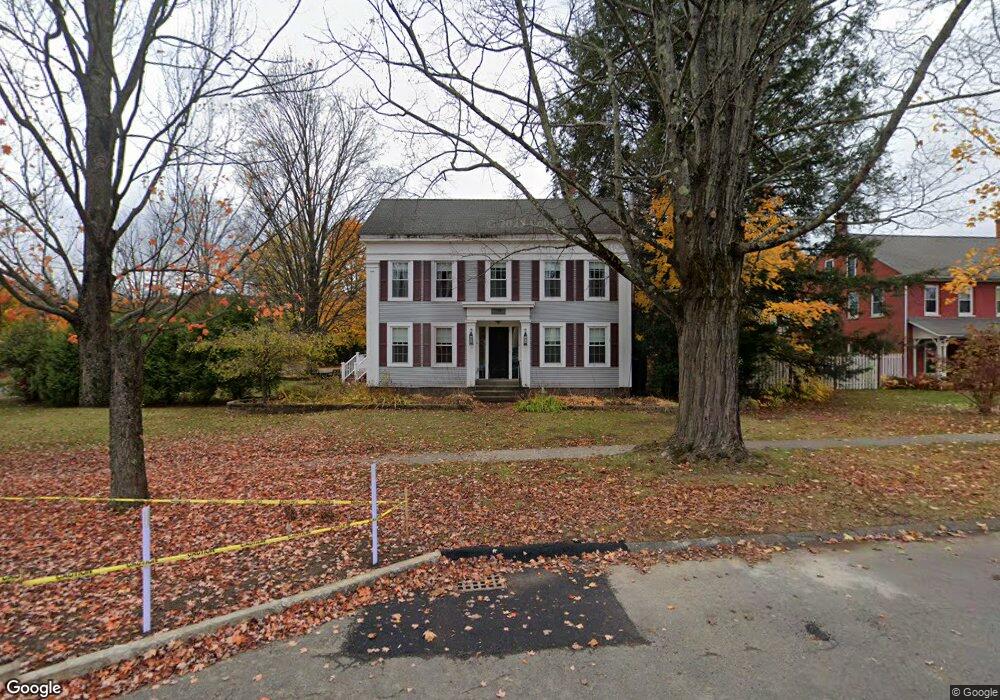
About This Home
This home is located at 50 Main St, Montague, MA 01351 and is currently estimated at $524,154, approximately $184 per square foot. 50 Main St is a home located in Franklin County.
Ownership History
Date
Name
Owned For
Owner Type
Purchase Details
Closed on
Nov 1, 2000
Sold by
Donnan Brigitte E and King Stephen J
Bought by
Mckenna Paul M and Mckenna Lisa E
Current Estimated Value
Home Financials for this Owner
Home Financials are based on the most recent Mortgage that was taken out on this home.
Original Mortgage
$178,000
Interest Rate
7.83%
Mortgage Type
Purchase Money Mortgage
Create a Home Valuation Report for This Property
The Home Valuation Report is an in-depth analysis detailing your home's value as well as a comparison with similar homes in the area
Home Values in the Area
Average Home Value in this Area
Purchase History
| Date | Buyer | Sale Price | Title Company |
|---|---|---|---|
| Mckenna Paul M | $178,000 | -- | |
| Mckenna Paul M | $178,000 | -- |
Source: Public Records
Mortgage History
| Date | Status | Borrower | Loan Amount |
|---|---|---|---|
| Open | Mckenna Paul M | $189,500 | |
| Closed | Mckenna Paul M | $178,000 | |
| Previous Owner | Mckenna Paul M | $20,000 |
Source: Public Records
Tax History Compared to Growth
Tax History
| Year | Tax Paid | Tax Assessment Tax Assessment Total Assessment is a certain percentage of the fair market value that is determined by local assessors to be the total taxable value of land and additions on the property. | Land | Improvement |
|---|---|---|---|---|
| 2025 | $6,159 | $404,900 | $100,900 | $304,000 |
| 2024 | $5,958 | $379,500 | $100,900 | $278,600 |
| 2023 | $5,837 | $373,000 | $100,900 | $272,100 |
| 2022 | $5,598 | $334,000 | $100,900 | $233,100 |
| 2021 | $5,910 | $338,900 | $110,300 | $228,600 |
| 2020 | $5,691 | $323,900 | $110,300 | $213,600 |
| 2019 | $5,521 | $322,300 | $117,600 | $204,700 |
| 2018 | $5,322 | $311,400 | $107,800 | $203,600 |
| 2017 | $5,191 | $311,400 | $107,800 | $203,600 |
| 2016 | $4,936 | $280,300 | $91,800 | $188,500 |
| 2015 | $4,754 | $280,300 | $91,800 | $188,500 |
| 2014 | $4,580 | $280,300 | $91,800 | $188,500 |
Source: Public Records
Map
Nearby Homes
- 64 Main St
- 2 Gunn Rd
- 35 A N Leverett Rd
- 132 Meadow Rd
- 10 Hannabrooke Dr
- 55 A + B Randall Rd
- 0 Pocumtuck Dr Unit 73379330
- 8 Craig Ave
- 5 Bridge St
- 202 Turnpike Rd
- 183 Millers Falls Rd
- 109 Montague City Rd
- 114 Montague St
- 2 Alice St
- 345 Greenfield Rd
- Lots 1-4 Kavanaugh Ln
- 89 Montague St
- 45 Millers Falls Rd
- 298 Deerfield St
- 0 Dudleyville Rd