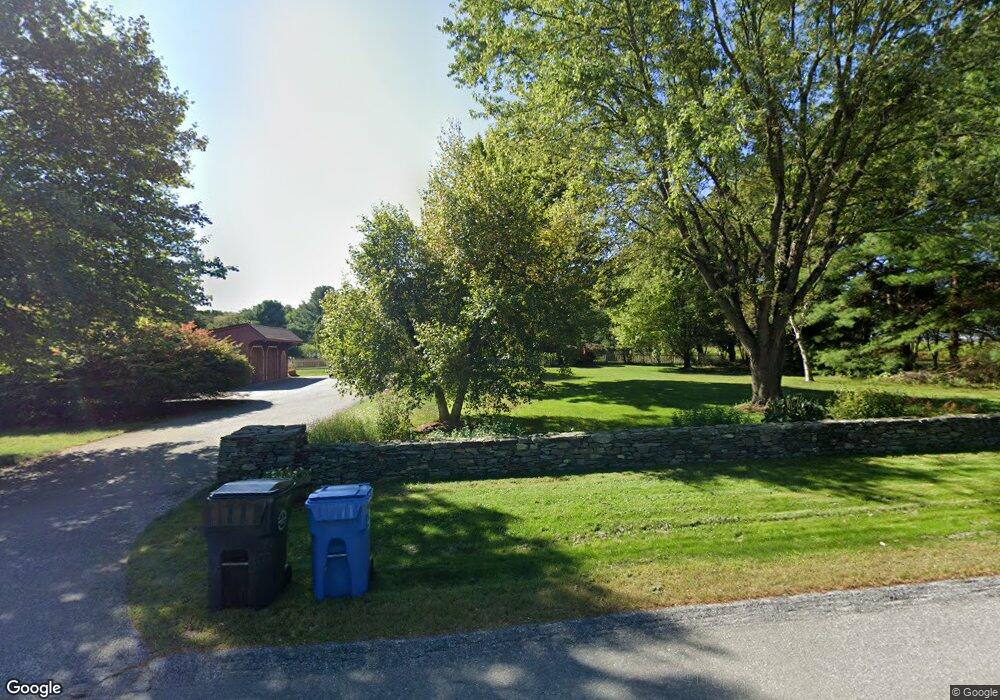
50 Mantup Rd Putnam, CT 06260
Estimated Value: $458,000 - $513,000
4
Beds
3
Baths
1,833
Sq Ft
$260/Sq Ft
Est. Value
About This Home
This home is located at 50 Mantup Rd, Putnam, CT 06260 and is currently estimated at $476,308, approximately $259 per square foot. 50 Mantup Rd is a home located in Windham County with nearby schools including Putnam Elementary School, Putnam Middle School, and Putnam High School.
Ownership History
Date
Name
Owned For
Owner Type
Purchase Details
Closed on
Dec 28, 1994
Sold by
Baum Michael E and Baum Denise
Bought by
Taft Timothy P and Quercia Kaleen B
Current Estimated Value
Home Financials for this Owner
Home Financials are based on the most recent Mortgage that was taken out on this home.
Original Mortgage
$132,750
Interest Rate
9.2%
Mortgage Type
Unknown
Purchase Details
Closed on
Jun 22, 1990
Sold by
White George
Bought by
Baum Md Michael
Create a Home Valuation Report for This Property
The Home Valuation Report is an in-depth analysis detailing your home's value as well as a comparison with similar homes in the area
Home Values in the Area
Average Home Value in this Area
Purchase History
| Date | Buyer | Sale Price | Title Company |
|---|---|---|---|
| Taft Timothy P | $147,500 | -- | |
| Baum Md Michael | $157,000 | -- |
Source: Public Records
Mortgage History
| Date | Status | Borrower | Loan Amount |
|---|---|---|---|
| Closed | Baum Md Michael | $35,000 | |
| Closed | Baum Md Michael | $143,600 | |
| Closed | Baum Md Michael | $132,750 | |
| Previous Owner | Baum Md Michael | $122,400 |
Source: Public Records
Tax History Compared to Growth
Tax History
| Year | Tax Paid | Tax Assessment Tax Assessment Total Assessment is a certain percentage of the fair market value that is determined by local assessors to be the total taxable value of land and additions on the property. | Land | Improvement |
|---|---|---|---|---|
| 2025 | $4,939 | $261,300 | $45,900 | $215,400 |
| 2024 | $6,876 | $273,500 | $45,500 | $228,000 |
| 2023 | $4,120 | $176,900 | $36,100 | $140,800 |
| 2022 | $3,925 | $176,900 | $36,100 | $140,800 |
| 2021 | $3,863 | $176,900 | $36,100 | $140,800 |
| 2020 | $3,863 | $176,900 | $36,000 | $140,900 |
| 2019 | $3,042 | $157,000 | $48,500 | $108,500 |
| 2018 | $2,955 | $156,500 | $48,500 | $108,000 |
| 2017 | $2,850 | $156,500 | $48,500 | $108,000 |
| 2016 | $2,823 | $156,500 | $48,500 | $108,000 |
| 2015 | $2,726 | $156,500 | $48,500 | $108,000 |
| 2014 | $2,751 | $171,200 | $55,300 | $115,900 |
Source: Public Records
Map
Nearby Homes
- 219 Pomfret St
- 213 Pomfret St
- 22 Chapman St
- 8 High St
- 115 Grove St
- 144 Underwood Rd
- 132 Grove St
- 29 Prospect St Unit A
- 24 Tatem St
- 9999 Prospect St
- 257 Sabin St Unit 23
- 84 Perry St Unit 220
- 87 Perry St Unit 238
- 76 S Prospect St
- 30 Tyrone Rd
- 214 Park Rd
- 37 Walnut St
- 26 Barber St Unit 28
- 10 Market St
- 88 Walnut St