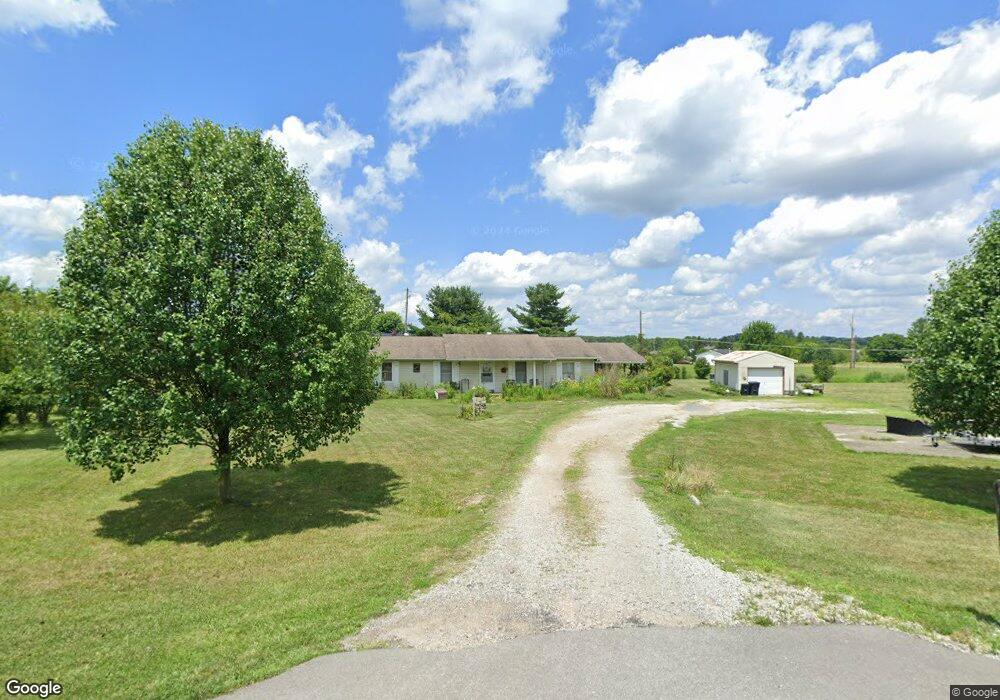
50 Mary Ln West Union, OH 45693
Estimated Value: $151,771 - $176,000
3
Beds
2
Baths
1,404
Sq Ft
$113/Sq Ft
Est. Value
About This Home
This home is located at 50 Mary Ln, West Union, OH 45693 and is currently estimated at $159,193, approximately $113 per square foot. 50 Mary Ln is a home located in Adams County with nearby schools including West Union Elementary School, West Union High School, and Adams County Christian School.
Ownership History
Date
Name
Owned For
Owner Type
Purchase Details
Closed on
Mar 11, 2010
Sold by
Co Federal Home Loan Mortgage Corp
Bought by
Mantle Terry and Mantle Lauvon
Current Estimated Value
Purchase Details
Closed on
Sep 17, 2009
Sold by
Osborn Charles E
Bought by
Co Fifth Third Mortgage Co
Purchase Details
Closed on
May 30, 2007
Sold by
Mantle Lauvon and Mantle Terry
Bought by
Osborn Charles E and Osborn Sandra K
Home Financials for this Owner
Home Financials are based on the most recent Mortgage that was taken out on this home.
Original Mortgage
$80,000
Interest Rate
6.22%
Mortgage Type
Purchase Money Mortgage
Purchase Details
Closed on
Oct 28, 2005
Sold by
Hardyman Arthur S and Hardyman Lila M
Bought by
Patterson Richard A and Patterson Vivian J
Purchase Details
Closed on
Mar 19, 2004
Sold by
Lewis Joe
Bought by
Mantle Lauvon
Purchase Details
Closed on
Apr 1, 1979
Bought by
Lewis Joe
Create a Home Valuation Report for This Property
The Home Valuation Report is an in-depth analysis detailing your home's value as well as a comparison with similar homes in the area
Home Values in the Area
Average Home Value in this Area
Purchase History
| Date | Buyer | Sale Price | Title Company |
|---|---|---|---|
| Mantle Terry | $25,000 | None Available | |
| Co Fifth Third Mortgage Co | $42,000 | None Available | |
| Osborn Charles E | $80,000 | None Available | |
| Patterson Richard A | $63,750 | None Available | |
| Mantle Lauvon | $42,000 | -- | |
| Lewis Joe | $28,000 | -- |
Source: Public Records
Mortgage History
| Date | Status | Borrower | Loan Amount |
|---|---|---|---|
| Previous Owner | Osborn Charles E | $80,000 |
Source: Public Records
Tax History Compared to Growth
Tax History
| Year | Tax Paid | Tax Assessment Tax Assessment Total Assessment is a certain percentage of the fair market value that is determined by local assessors to be the total taxable value of land and additions on the property. | Land | Improvement |
|---|---|---|---|---|
| 2024 | $1,160 | $34,160 | $7,980 | $26,180 |
| 2023 | $1,163 | $34,160 | $7,980 | $26,180 |
| 2022 | $1,158 | $30,520 | $6,930 | $23,590 |
| 2021 | $1,122 | $30,520 | $6,930 | $23,590 |
| 2020 | $1,147 | $30,520 | $6,930 | $23,590 |
| 2019 | $1,147 | $30,520 | $6,930 | $23,590 |
| 2018 | $1,011 | $27,440 | $6,930 | $20,510 |
| 2017 | $995 | $27,440 | $6,930 | $20,510 |
| 2016 | $497 | $27,440 | $6,930 | $20,510 |
| 2015 | $1,015 | $29,020 | $6,930 | $22,090 |
| 2014 | $1,016 | $29,020 | $6,930 | $22,090 |
Source: Public Records
Map
Nearby Homes
- 260 Randy St
- 216 Kurt St
- 410 Owens Rd
- 0 State Route 41 Unit 1830107
- 1155 Gatewood Dr
- 292 Larry Baynum Rd
- 3188 Ohio 125
- 819 E Main St
- 1082 E Walnut St
- 622 Boyd Ave
- 610 Boyd Ave
- 3460 Logans Ln
- 902 E Walnut St
- 430 Poplar St
- 601 E Main St
- 3910 Logans Ln
- 70 Logans Ln
- 222 Kennedy Ave
- 725 E Walnut St
- 185 Windfield Dr
- 30 Mary Ln
- 70 Mary Ln
- 43 Mary Ln
- 14608 State Route 41
- 10 Mary Ln
- 85 Mary Ln
- 18 Page School Rd
- 60 Page School Rd
- 14654 State Route 41
- 110 Mary Ln
- 14527 State Route 41
- 61 Susan Ln
- 100 Page School Rd
- 135 Mary Ln
- 14591 State Route 41
- 14591 State Route 41
- 140 Mary Ln
- 13655 State Route 41
- 23 Michael Ln
- 0 State Route 41