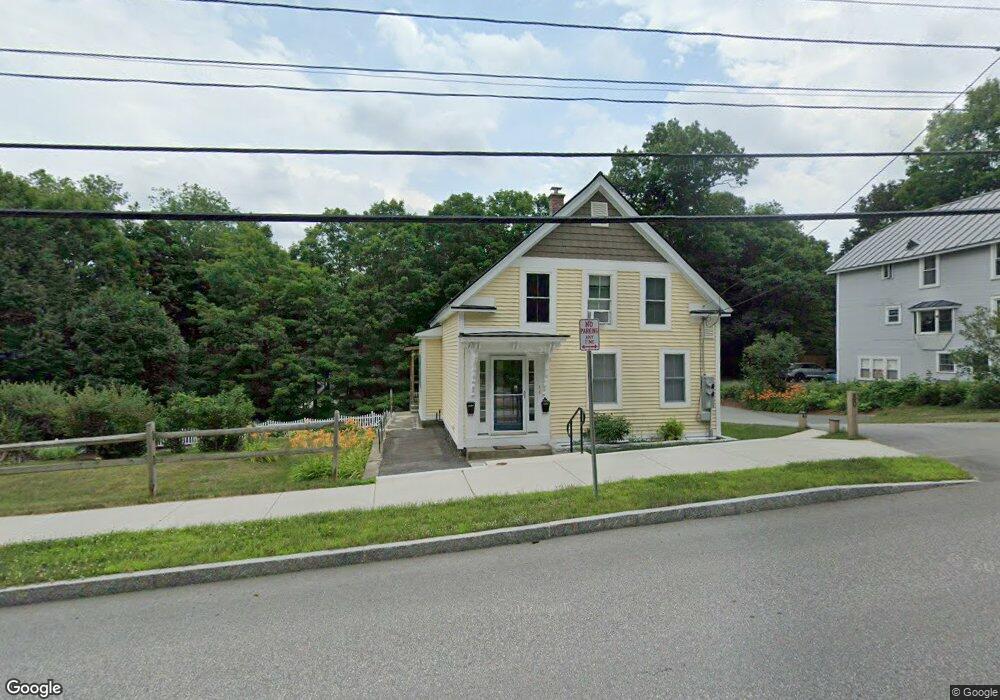
50 Mascoma St Lebanon, NH 03766
Estimated Value: $394,703 - $595,000
4
Beds
2
Baths
2,043
Sq Ft
$252/Sq Ft
Est. Value
About This Home
This home is located at 50 Mascoma St, Lebanon, NH 03766 and is currently estimated at $514,926, approximately $252 per square foot. 50 Mascoma St is a home located in Grafton County with nearby schools including Hanover Street School, Lebanon Middle School, and Lebanon High School.
Ownership History
Date
Name
Owned For
Owner Type
Purchase Details
Closed on
Feb 3, 2011
Sold by
Fhlmc
Bought by
Kattamis Nicholas T and Kattamis Rebecca A
Current Estimated Value
Home Financials for this Owner
Home Financials are based on the most recent Mortgage that was taken out on this home.
Original Mortgage
$123,900
Outstanding Balance
$84,943
Interest Rate
4.82%
Mortgage Type
Purchase Money Mortgage
Estimated Equity
$429,983
Purchase Details
Closed on
Sep 14, 2010
Sold by
Eastman Jennifer A and Eastman Fhlmc
Bought by
Fhlmc
Purchase Details
Closed on
Aug 30, 2004
Sold by
Eastman Mark F
Bought by
Eastman Jennifer A
Home Financials for this Owner
Home Financials are based on the most recent Mortgage that was taken out on this home.
Original Mortgage
$110,000
Interest Rate
6.02%
Mortgage Type
Purchase Money Mortgage
Create a Home Valuation Report for This Property
The Home Valuation Report is an in-depth analysis detailing your home's value as well as a comparison with similar homes in the area
Home Values in the Area
Average Home Value in this Area
Purchase History
| Date | Buyer | Sale Price | Title Company |
|---|---|---|---|
| Kattamis Nicholas T | $154,900 | -- | |
| Fhlmc | $160,100 | -- | |
| Eastman Jennifer A | $95,000 | -- |
Source: Public Records
Mortgage History
| Date | Status | Borrower | Loan Amount |
|---|---|---|---|
| Open | Eastman Jennifer A | $123,900 | |
| Previous Owner | Eastman Jennifer A | $40,000 | |
| Previous Owner | Eastman Jennifer A | $110,000 |
Source: Public Records
Tax History Compared to Growth
Tax History
| Year | Tax Paid | Tax Assessment Tax Assessment Total Assessment is a certain percentage of the fair market value that is determined by local assessors to be the total taxable value of land and additions on the property. | Land | Improvement |
|---|---|---|---|---|
| 2024 | $8,092 | $307,900 | $73,900 | $234,000 |
| 2023 | $7,476 | $307,900 | $73,900 | $234,000 |
| 2022 | $7,094 | $307,900 | $73,900 | $234,000 |
| 2021 | $5,620 | $208,300 | $52,700 | $155,600 |
| 2019 | $5,409 | $178,100 | $50,500 | $127,600 |
| 2018 | $5,293 | $178,100 | $50,500 | $127,600 |
| 2017 | $5,188 | $178,400 | $50,500 | $127,900 |
| 2016 | $5,018 | $178,400 | $50,500 | $127,900 |
| 2015 | $4,926 | $178,400 | $50,500 | $127,900 |
| 2014 | $4,886 | $186,000 | $57,200 | $128,800 |
| 2013 | $4,339 | $170,100 | $57,200 | $112,900 |
Source: Public Records
Map
Nearby Homes
- 29 Mascoma St
- 43 Water St Unit 45
- 25 West St
- 69 Etna Rd Unit 220
- 31 Wheatley St
- 26 Parkhurst St
- 127 Hanover St
- 77 Prospect St
- 174 Meriden Rd
- 139 Heater Rd
- 60 Mountain View Dr
- 121 Slayton Hill Rd
- 20 Alden Rd
- 8 Stage Coach Rd
- 4 Black Bear Ct
- 94 Dogwood Cir
- 14 Maries Way
- 0 Mount Support Rd
- 262 Dartmouth College Hwy
- 45 Riverside Dr