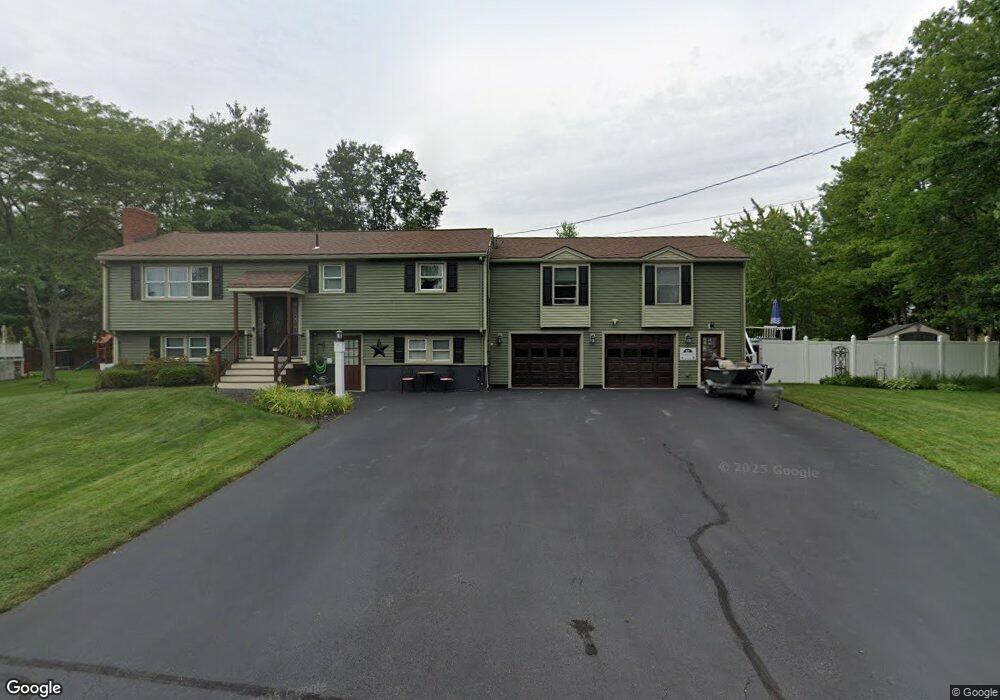
50 Matthias St Salem, NH 03079
Salem Center NeighborhoodEstimated Value: $693,000 - $771,000
4
Beds
3
Baths
3,048
Sq Ft
$240/Sq Ft
Est. Value
About This Home
This home is located at 50 Matthias St, Salem, NH 03079 and is currently estimated at $730,129, approximately $239 per square foot. 50 Matthias St is a home located in Rockingham County with nearby schools including William T. Barron Elementary School, Woodbury School, and Salem High School.
Ownership History
Date
Name
Owned For
Owner Type
Purchase Details
Closed on
Jun 2, 2011
Sold by
Desantis John R and Desantis Amy L
Bought by
Lister Cheryl A
Current Estimated Value
Home Financials for this Owner
Home Financials are based on the most recent Mortgage that was taken out on this home.
Original Mortgage
$240,885
Outstanding Balance
$167,765
Interest Rate
4.85%
Mortgage Type
Purchase Money Mortgage
Estimated Equity
$562,364
Purchase Details
Closed on
Dec 18, 2000
Sold by
Mctiernan Lawrence and Mctiernan Cindy L
Bought by
Desantis John R
Home Financials for this Owner
Home Financials are based on the most recent Mortgage that was taken out on this home.
Original Mortgage
$159,200
Interest Rate
7.7%
Purchase Details
Closed on
Aug 25, 1997
Sold by
Mcevoy Joyce M
Bought by
Mctiernan Lawrence and Mctiernan Cindy L
Home Financials for this Owner
Home Financials are based on the most recent Mortgage that was taken out on this home.
Original Mortgage
$117,520
Interest Rate
7.42%
Create a Home Valuation Report for This Property
The Home Valuation Report is an in-depth analysis detailing your home's value as well as a comparison with similar homes in the area
Home Values in the Area
Average Home Value in this Area
Purchase History
| Date | Buyer | Sale Price | Title Company |
|---|---|---|---|
| Lister Cheryl A | $265,000 | -- | |
| Desantis John R | $199,000 | -- | |
| Mctiernan Lawrence | $146,900 | -- |
Source: Public Records
Mortgage History
| Date | Status | Borrower | Loan Amount |
|---|---|---|---|
| Open | Mctiernan Lawrence | $240,885 | |
| Previous Owner | Mctiernan Lawrence | $159,200 | |
| Previous Owner | Mctiernan Lawrence | $117,520 |
Source: Public Records
Tax History Compared to Growth
Tax History
| Year | Tax Paid | Tax Assessment Tax Assessment Total Assessment is a certain percentage of the fair market value that is determined by local assessors to be the total taxable value of land and additions on the property. | Land | Improvement |
|---|---|---|---|---|
| 2024 | $9,164 | $520,700 | $177,100 | $343,600 |
| 2023 | $8,831 | $520,700 | $177,100 | $343,600 |
| 2022 | $8,357 | $520,700 | $177,100 | $343,600 |
| 2021 | $8,321 | $520,700 | $177,100 | $343,600 |
| 2020 | $7,588 | $344,600 | $126,500 | $218,100 |
| 2019 | $7,574 | $344,600 | $126,500 | $218,100 |
| 2018 | $7,447 | $344,600 | $126,500 | $218,100 |
| 2017 | $6,902 | $331,200 | $126,500 | $204,700 |
| 2016 | $6,766 | $331,200 | $126,500 | $204,700 |
| 2015 | $6,432 | $300,700 | $125,900 | $174,800 |
| 2014 | $6,252 | $300,700 | $125,900 | $174,800 |
| 2013 | $6,152 | $300,700 | $125,900 | $174,800 |
Source: Public Records
Map
Nearby Homes
- 20 Stanwood Rd
- 40 Stanwood Rd Unit 9
- 6 Douglas Dr
- 139 North St
- 10 Sally Sweets Way Unit V104
- 20 Ashwood Ave
- 35 Fraser Dr
- 1 Ballard Ln
- 1 Kimball Ave
- 74 Ayers Village Rd
- 1513 Broadway
- 27 General Pulaski Dr
- 8 Alta Ave
- 12 Braemoor Woods Rd Unit 206
- 35 Linwood Ave
- 4 Mulberry Rd
- 15 Linwood Ave
- 47 Bailey Ct
- 10 Evelyn Rd
- 4 Therriault Ave