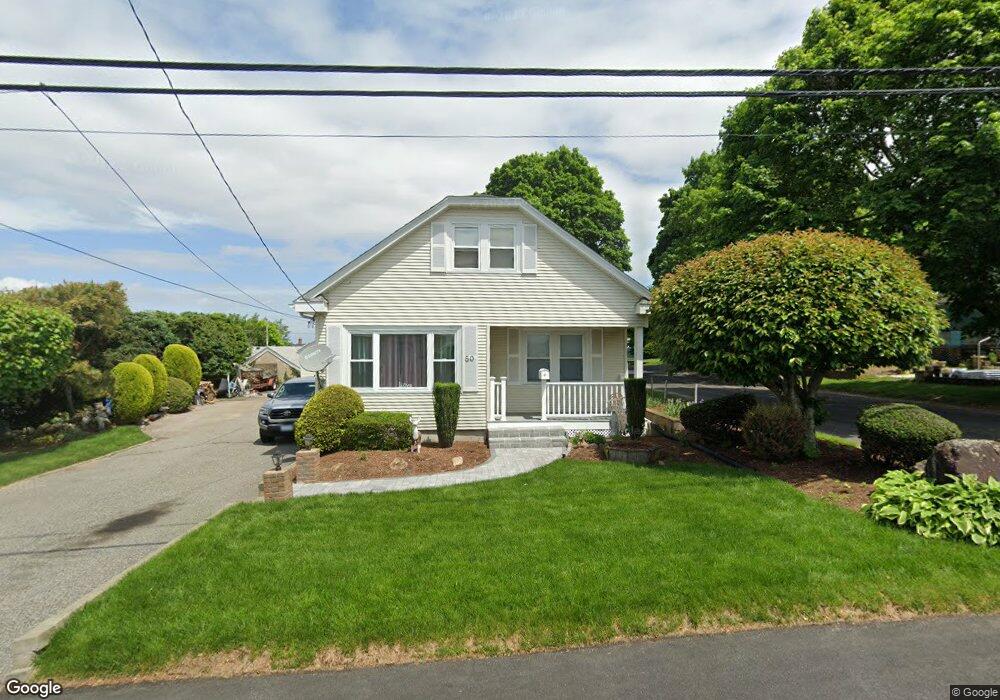
50 Morgan St Cranston, RI 02920
Thornton NeighborhoodEstimated Value: $394,854 - $447,000
3
Beds
1
Bath
1,404
Sq Ft
$303/Sq Ft
Est. Value
About This Home
This home is located at 50 Morgan St, Cranston, RI 02920 and is currently estimated at $424,964, approximately $302 per square foot. 50 Morgan St is a home located in Providence County with nearby schools including Stone Hill School, Western Hills Middle School, and Cranston High School West.
Ownership History
Date
Name
Owned For
Owner Type
Purchase Details
Closed on
Jul 19, 2004
Sold by
Viti Beatrice
Bought by
Perez Maribianca
Current Estimated Value
Home Financials for this Owner
Home Financials are based on the most recent Mortgage that was taken out on this home.
Original Mortgage
$191,200
Interest Rate
6.25%
Mortgage Type
Purchase Money Mortgage
Purchase Details
Closed on
Jul 31, 1997
Sold by
Dipaolo James R and Dipaolo Josephine
Bought by
Viti Beatrice M
Purchase Details
Closed on
Sep 23, 1988
Sold by
Votto Raymond L
Bought by
Dipaolo James R
Create a Home Valuation Report for This Property
The Home Valuation Report is an in-depth analysis detailing your home's value as well as a comparison with similar homes in the area
Home Values in the Area
Average Home Value in this Area
Purchase History
| Date | Buyer | Sale Price | Title Company |
|---|---|---|---|
| Perez Maribianca | $239,000 | -- | |
| Viti Beatrice M | $100,000 | -- | |
| Dipaolo James R | $38,500 | -- |
Source: Public Records
Mortgage History
| Date | Status | Borrower | Loan Amount |
|---|---|---|---|
| Open | Dipaolo James R | $263,300 | |
| Closed | Dipaolo James R | $247,500 | |
| Closed | Dipaolo James R | $191,200 |
Source: Public Records
Tax History
| Year | Tax Paid | Tax Assessment Tax Assessment Total Assessment is a certain percentage of the fair market value that is determined by local assessors to be the total taxable value of land and additions on the property. | Land | Improvement |
|---|---|---|---|---|
| 2025 | $4,465 | $321,700 | $112,800 | $208,900 |
| 2024 | $4,378 | $321,700 | $112,800 | $208,900 |
| 2023 | $4,113 | $217,600 | $74,300 | $143,300 |
| 2022 | $4,028 | $217,600 | $74,300 | $143,300 |
| 2021 | $3,917 | $217,600 | $74,300 | $143,300 |
| 2020 | $3,799 | $182,900 | $70,700 | $112,200 |
| 2019 | $3,799 | $182,900 | $70,700 | $112,200 |
| 2018 | $3,711 | $182,900 | $70,700 | $112,200 |
| 2017 | $3,471 | $151,300 | $63,600 | $87,700 |
| 2016 | $3,397 | $151,300 | $63,600 | $87,700 |
| 2015 | $3,397 | $151,300 | $63,600 | $87,700 |
| 2014 | $3,344 | $146,400 | $63,600 | $82,800 |
Source: Public Records
Map
Nearby Homes
- 0 Macera Dr
- 9 Baker St
- 0 Plainfield Pike Unit 1374314
- 0 Clemence St
- 244 Stony Acre Dr
- 50 Clemence St Unit 50
- 82 Clemence St
- 0 Myrtle Ave
- 83 Valente Dr
- 1603 Plainfield Pike Unit G8
- 93 Elena St
- 72 Westfield Dr
- 16 Shaw Ave
- 5 Deluca St
- 27 Nardolillo St
- 73 Maple Ave
- 00 Burton St
- 1757 Plainfield Pike
- 5 Pico Cir
- 7 Pico Cir
Your Personal Tour Guide
Ask me questions while you tour the home.