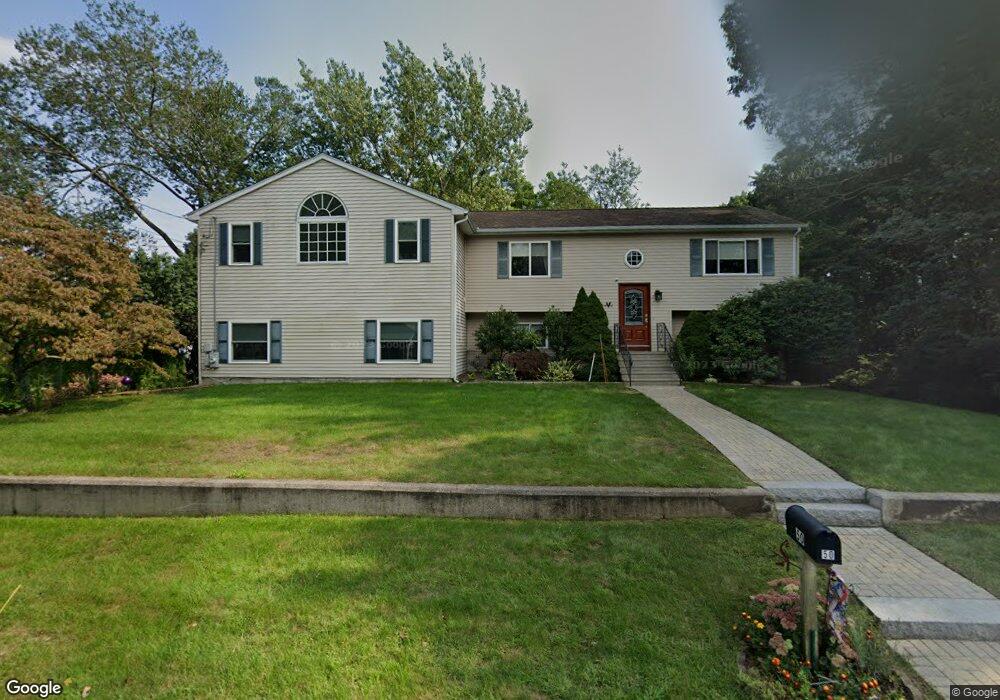
50 Morris St Warwick, RI 02889
Conimicut-Shawomet NeighborhoodEstimated Value: $425,000 - $521,000
2
Beds
1
Bath
1,584
Sq Ft
$305/Sq Ft
Est. Value
About This Home
This home is located at 50 Morris St, Warwick, RI 02889 and is currently estimated at $482,861, approximately $304 per square foot. 50 Morris St is a home located in Kent County with nearby schools including Saint Kevin School and Bishop Hendricken High School.
Ownership History
Date
Name
Owned For
Owner Type
Purchase Details
Closed on
Apr 11, 2025
Sold by
Melbourne Kathleen M
Bought by
Melbourne Kathleen M and Close Lisa M
Current Estimated Value
Purchase Details
Closed on
Sep 16, 2003
Sold by
Roberts Laurelle B and Esancy Joyce M
Bought by
Melbourne Kathleen M
Home Financials for this Owner
Home Financials are based on the most recent Mortgage that was taken out on this home.
Original Mortgage
$169,575
Interest Rate
6.22%
Mortgage Type
Purchase Money Mortgage
Purchase Details
Closed on
May 12, 1995
Sold by
Paul Gerald Dev Inc
Bought by
Roberts Laurelle B and Esancy Joyce M
Home Financials for this Owner
Home Financials are based on the most recent Mortgage that was taken out on this home.
Original Mortgage
$85,690
Interest Rate
8.31%
Mortgage Type
Purchase Money Mortgage
Create a Home Valuation Report for This Property
The Home Valuation Report is an in-depth analysis detailing your home's value as well as a comparison with similar homes in the area
Home Values in the Area
Average Home Value in this Area
Purchase History
| Date | Buyer | Sale Price | Title Company |
|---|---|---|---|
| Melbourne Kathleen M | -- | None Available | |
| Melbourne Kathleen M | -- | None Available | |
| Melbourne Kathleen M | $178,500 | -- | |
| Melbourne Kathleen M | $178,500 | -- | |
| Roberts Laurelle B | $95,000 | -- | |
| Roberts Laurelle B | $95,000 | -- |
Source: Public Records
Mortgage History
| Date | Status | Borrower | Loan Amount |
|---|---|---|---|
| Previous Owner | Roberts Laurelle B | $169,575 | |
| Previous Owner | Roberts Laurelle B | $85,690 |
Source: Public Records
Tax History
| Year | Tax Paid | Tax Assessment Tax Assessment Total Assessment is a certain percentage of the fair market value that is determined by local assessors to be the total taxable value of land and additions on the property. | Land | Improvement |
|---|---|---|---|---|
| 2025 | $5,706 | $449,300 | $100,900 | $348,400 |
| 2024 | $5,484 | $379,000 | $83,300 | $295,700 |
| 2023 | $5,378 | $379,000 | $83,300 | $295,700 |
| 2022 | $5,138 | $274,300 | $50,400 | $223,900 |
| 2021 | $5,138 | $274,300 | $50,400 | $223,900 |
| 2020 | $5,138 | $274,300 | $50,400 | $223,900 |
| 2019 | $5,138 | $274,300 | $50,400 | $223,900 |
| 2018 | $4,755 | $228,600 | $50,400 | $178,200 |
| 2017 | $4,627 | $228,600 | $50,400 | $178,200 |
| 2016 | $4,627 | $228,600 | $50,400 | $178,200 |
| 2015 | $4,492 | $216,500 | $58,700 | $157,800 |
| 2014 | -- | $216,500 | $58,700 | $157,800 |
| 2013 | $4,285 | $216,500 | $58,700 | $157,800 |
Source: Public Records
Map
Nearby Homes