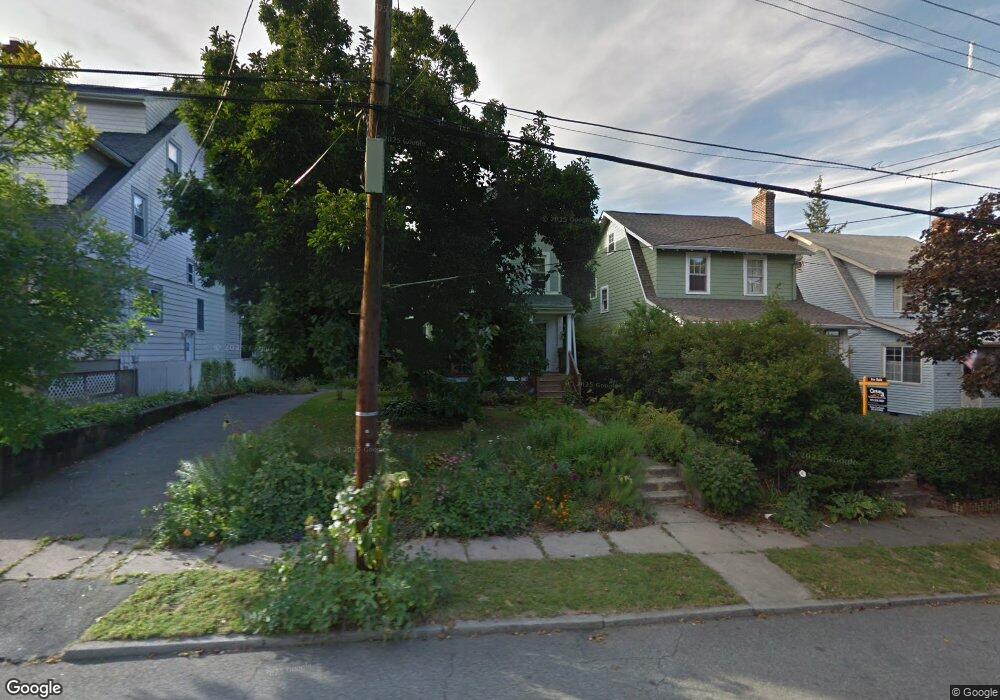
50 Morse Ave Bloomfield, NJ 07003
Estimated Value: $484,369 - $583,000
Studio
--
Bath
1,389
Sq Ft
$379/Sq Ft
Est. Value
About This Home
This home is located at 50 Morse Ave, Bloomfield, NJ 07003 and is currently estimated at $527,092, approximately $379 per square foot. 50 Morse Ave is a home located in Essex County with nearby schools including Watsessing Elementary School, Bloomfield Middle School, and Bloomfield High School.
Ownership History
Date
Name
Owned For
Owner Type
Purchase Details
Closed on
Apr 5, 2006
Sold by
Brown John
Bought by
Warnasch Scott and Warnasch Linda
Current Estimated Value
Home Financials for this Owner
Home Financials are based on the most recent Mortgage that was taken out on this home.
Original Mortgage
$272,400
Outstanding Balance
$156,629
Interest Rate
6.37%
Mortgage Type
New Conventional
Estimated Equity
$370,463
Purchase Details
Closed on
Dec 27, 2000
Sold by
Russo & Petti Llc
Bought by
Brown John and Brown Valentina
Home Financials for this Owner
Home Financials are based on the most recent Mortgage that was taken out on this home.
Original Mortgage
$151,900
Interest Rate
7.64%
Purchase Details
Closed on
Apr 11, 2000
Sold by
Ricco
Bought by
Russo
Create a Home Valuation Report for This Property
The Home Valuation Report is an in-depth analysis detailing your home's value as well as a comparison with similar homes in the area
Home Values in the Area
Average Home Value in this Area
Purchase History
| Date | Buyer | Sale Price | Title Company |
|---|---|---|---|
| Warnasch Scott | $340,500 | -- | |
| Brown John | $159,900 | -- | |
| Russo | $50,000 | -- | |
| Russo | $50,000 | -- |
Source: Public Records
Mortgage History
| Date | Status | Borrower | Loan Amount |
|---|---|---|---|
| Open | Warnasch Scott | $272,400 | |
| Previous Owner | Brown John | $151,900 |
Source: Public Records
Tax History
| Year | Tax Paid | Tax Assessment Tax Assessment Total Assessment is a certain percentage of the fair market value that is determined by local assessors to be the total taxable value of land and additions on the property. | Land | Improvement |
|---|---|---|---|---|
| 2025 | $9,284 | $284,100 | $148,400 | $135,700 |
| 2024 | $9,284 | $284,100 | $148,400 | $135,700 |
| 2022 | $9,097 | $284,100 | $148,400 | $135,700 |
| 2021 | $8,929 | $284,100 | $148,400 | $135,700 |
| 2020 | $8,793 | $284,100 | $148,400 | $135,700 |
| 2019 | $9,869 | $247,900 | $132,000 | $115,900 |
| 2018 | $9,827 | $247,900 | $132,000 | $115,900 |
| 2017 | $9,678 | $247,900 | $132,000 | $115,900 |
| 2016 | $9,569 | $247,900 | $132,000 | $115,900 |
| 2015 | $9,482 | $247,900 | $132,000 | $115,900 |
| 2014 | $9,309 | $247,900 | $132,000 | $115,900 |
Source: Public Records
Map
Nearby Homes