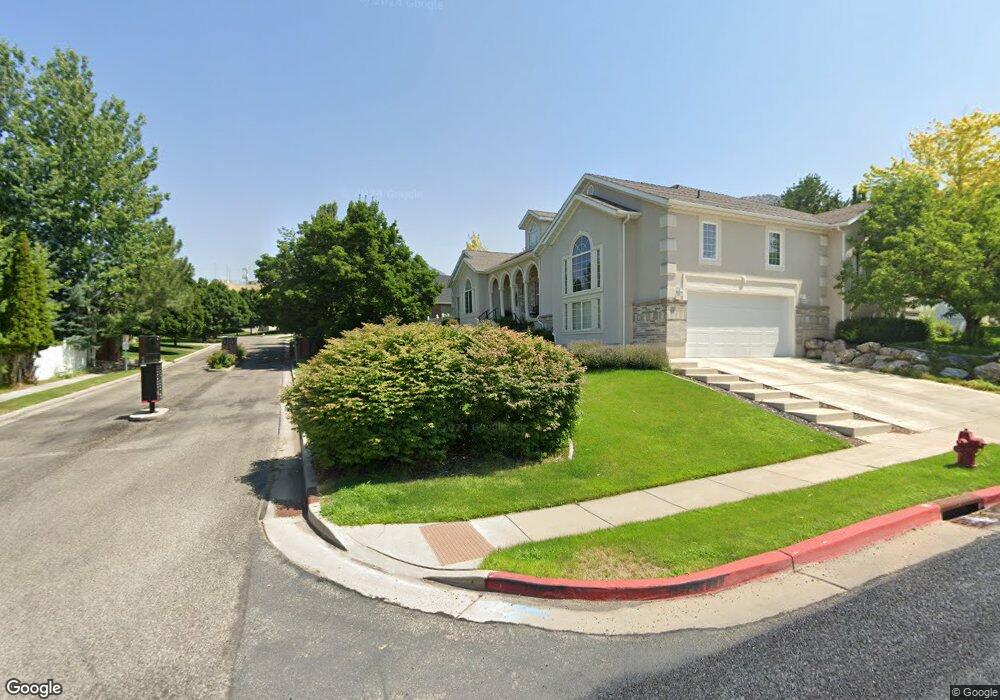
50 N Quail Hollow Rd Unit 104 Logan, UT 84321
Wilson NeighborhoodEstimated Value: $837,000 - $1,030,000
--
Bed
--
Bath
2,742
Sq Ft
$335/Sq Ft
Est. Value
About This Home
This home is located at 50 N Quail Hollow Rd Unit 104, Logan, UT 84321 and is currently estimated at $918,986, approximately $335 per square foot. 50 N Quail Hollow Rd Unit 104 is a home located in Cache County with nearby schools including Wilson School, Mount Logan Middle School, and Logan High School.
Ownership History
Date
Name
Owned For
Owner Type
Purchase Details
Closed on
Feb 21, 2025
Sold by
Peterson Jacob W and Peterson Kristina R
Bought by
Jacob And Kristina Peterson Living Trust and Peterson
Current Estimated Value
Purchase Details
Closed on
Aug 14, 2017
Sold by
Parkinson Paul Dunford and Parkinson Rebecca Johnson
Bought by
Peterson Jacob W and Peterson Kristina R
Home Financials for this Owner
Home Financials are based on the most recent Mortgage that was taken out on this home.
Original Mortgage
$150,000
Interest Rate
3.96%
Mortgage Type
New Conventional
Purchase Details
Closed on
Jul 29, 2009
Sold by
Taylor Matthew G
Bought by
Parkinson Paul Dunford and Parkinson Rebecca Johnson
Create a Home Valuation Report for This Property
The Home Valuation Report is an in-depth analysis detailing your home's value as well as a comparison with similar homes in the area
Home Values in the Area
Average Home Value in this Area
Purchase History
| Date | Buyer | Sale Price | Title Company |
|---|---|---|---|
| Jacob And Kristina Peterson Living Trust | -- | None Listed On Document | |
| Jacob And Kristina Peterson Living Trust | -- | None Listed On Document | |
| Peterson Jacob W | -- | None Available | |
| Parkinson Paul Dunford | -- | Cache Title Company |
Source: Public Records
Mortgage History
| Date | Status | Borrower | Loan Amount |
|---|---|---|---|
| Previous Owner | Peterson Jacob W | $150,000 |
Source: Public Records
Tax History Compared to Growth
Tax History
| Year | Tax Paid | Tax Assessment Tax Assessment Total Assessment is a certain percentage of the fair market value that is determined by local assessors to be the total taxable value of land and additions on the property. | Land | Improvement |
|---|---|---|---|---|
| 2025 | $3,636 | $470,200 | $0 | $0 |
| 2024 | $3,762 | $471,190 | $0 | $0 |
| 2023 | $3,851 | $459,845 | $0 | $0 |
| 2022 | $4,124 | $459,845 | $0 | $0 |
| 2021 | $3,628 | $625,025 | $84,800 | $540,225 |
| 2020 | $3,637 | $563,856 | $84,800 | $479,056 |
| 2019 | $3,801 | $563,855 | $84,800 | $479,055 |
| 2018 | $3,702 | $501,370 | $84,800 | $416,570 |
| 2017 | $3,560 | $254,925 | $0 | $0 |
| 2016 | $3,691 | $248,325 | $0 | $0 |
| 2015 | $3,442 | $237,450 | $0 | $0 |
| 2014 | $3,112 | $237,450 | $0 | $0 |
| 2013 | -- | $237,450 | $0 | $0 |
Source: Public Records
Map
Nearby Homes
- 10 S 1300 E
- 1605 Mountain Rd
- 147 Winding Way Unit 50
- 159 Winding Way Unit 49
- 1374 E 260 N
- 1279 Eastridge Dr
- 1387 E 260 N
- 240 N 1480 E
- 128 S 1170 E
- 1383 Mount Logan Loop
- 357 Paintbrush Ln
- 1034 Thrushwood Dr
- 1045 Fox Farm Rd
- 28 River Pointe Dr
- 1425 E 700 N
- 556 N 520 E
- 820 Hillcrest Ave
- 720 E 525 N Unit 32
- Cedar Ridge Plan at Shoreline Estates
- Strata Plan at Shoreline Estates
- 50 Quail Hollow Rd
- 30 N Quail Hollow Rd
- 62 N Quail Hollow Rd
- 62 N Quail Hollow Rd Unit 105
- 1457 Mountain Rd
- 53 Quail Hollow Rd
- 53 N Quail Hollow Rd Unit 119
- 1471 Mountain Rd
- 1413 Mountain Rd
- 74 N Quail Hollow Rd Unit 106
- 41 Winding Way
- 74 Quail Hollow Rd
- 71 N Quail Hollow Rd Unit 118
- 71 Quail Hollow Rd
- 57 Winding Way
- 30 Ptarmigan Loop
- 73 Winding Way
- 40 Ptarmigan Loop
- 1422 Mountain Rd
- 1468 Mountain Rd