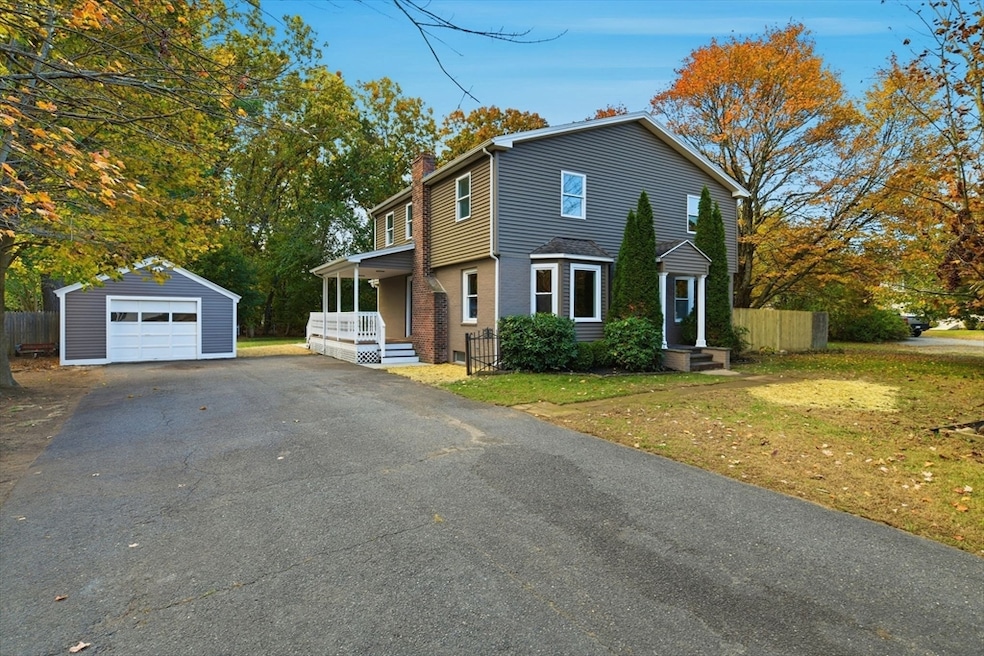
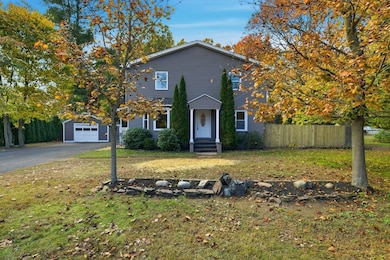
50 Pine St South Hadley, MA 01075
Estimated payment $3,258/month
Highlights
- Medical Services
- Colonial Architecture
- Wooded Lot
- Open Floorplan
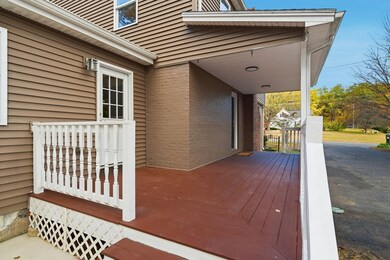
- Covered Deck
- Vaulted Ceiling
About This Home
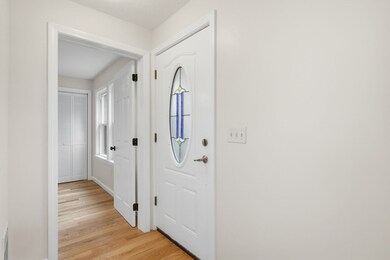
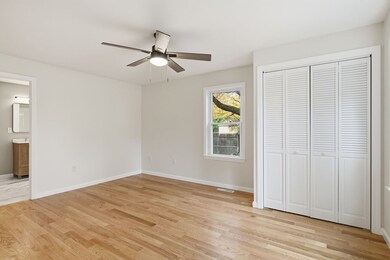
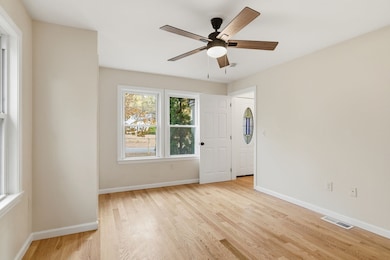
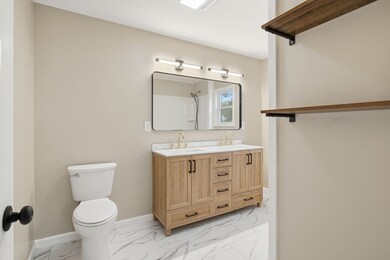
This sophisticated, well-maintained home impresses at every turn with quality updates and timeless design. Gorgeous red oak flooring welcomes you into an open-concept living area perfect for entertaining—featuring a spacious living room and chef's kitchen with quartz countertops, plentiful cabinetry, pantry, and all-new stainless steel appliances including a gas range & double oven. The main-floor primary suite is complete w/ a full bath featuring a double vanity and walk-in shower, while a convenient first floor half bath with laundry adds convenience & everyday ease. Vaulted ceilings & fun breakfast bar in the dining room which opens through French doors to a great patio space and nearly a 3/4 acre lot, ideal for gatherings or relaxation alike. Upstairs, five bedrooms and two full baths offer remarkable versatility, complemented by a finished basement. Gas heat & new central air! With a detached garage, fenced yard, and a privacy set back from the road—this home truly has it all!
Listing Agent
Melissa Fitzgerald
Lock and Key Realty Inc. Listed on: 10/27/2025

Home Details
Home Type
- Single Family
Est. Annual Taxes
- $5,918
Year Built
- Built in 1949
Lot Details
- 0.66 Acre Lot
- Fenced Yard
- Level Lot
- Cleared Lot
- Wooded Lot
- Garden
- Property is zoned RA1
Parking
- 1 Car Detached Garage
- Driveway
- Open Parking
- Off-Street Parking
Home Design
- Colonial Architecture
- Block Foundation
- Shingle Roof
Interior Spaces
- Open Floorplan
- Vaulted Ceiling
- Ceiling Fan
- Bay Window
- French Doors
- Bonus Room
Kitchen
- Breakfast Bar
- Double Oven
- Range
- Dishwasher
- Stainless Steel Appliances
- Kitchen Island
- Solid Surface Countertops
Flooring
- Wood
- Wall to Wall Carpet
- Vinyl
Bedrooms and Bathrooms
- 6 Bedrooms
- Primary Bedroom on Main
- Double Vanity
- Bathtub with Shower
- Separate Shower
Laundry
- Laundry on main level
- Washer and Gas Dryer Hookup
Finished Basement
- Basement Fills Entire Space Under The House
- Interior and Exterior Basement Entry
Outdoor Features
- Bulkhead
- Covered Deck
- Covered Patio or Porch
Location
- Property is near schools
Utilities
- Central Air
- Heating System Uses Natural Gas
- Pellet Stove burns compressed wood to generate heat
- Baseboard Heating
Listing and Financial Details
- Assessor Parcel Number M:0040 B:0018 L:0000,3063195
Community Details
Overview
- No Home Owners Association
Amenities
- Medical Services
- Shops
Recreation
- Park
- Jogging Path
Map
Home Values in the Area
Average Home Value in this Area
Tax History
| Year | Tax Paid | Tax Assessment Tax Assessment Total Assessment is a certain percentage of the fair market value that is determined by local assessors to be the total taxable value of land and additions on the property. | Land | Improvement |
|---|---|---|---|---|
| 2025 | $5,918 | $371,500 | $119,300 | $252,200 |
| 2024 | $6,087 | $365,600 | $111,600 | $254,000 |
| 2023 | $5,509 | $313,900 | $101,200 | $212,700 |
| 2022 | $5,272 | $285,300 | $101,200 | $184,100 |
| 2021 | $5,209 | $267,700 | $94,700 | $173,000 |
| 2020 | $5,085 | $255,000 | $94,700 | $160,300 |
| 2019 | $5,078 | $252,000 | $90,100 | $161,900 |
| 2018 | $1,058 | $244,700 | $87,800 | $156,900 |
| 2017 | $4,696 | $233,400 | $87,800 | $145,600 |
| 2016 | $4,609 | $232,200 | $87,800 | $144,400 |
| 2015 | $4,372 | $225,600 | $85,200 | $140,400 |
Property History
| Date | Event | Price | List to Sale | Price per Sq Ft |
|---|---|---|---|---|
| 10/30/2025 10/30/25 | Pending | -- | -- | -- |
| 10/27/2025 10/27/25 | For Sale | $525,000 | -- | $205 / Sq Ft |
Purchase History
| Date | Type | Sale Price | Title Company |
|---|---|---|---|
| Quit Claim Deed | $320,000 | None Available | |
| Quit Claim Deed | $320,000 | None Available | |
| Quit Claim Deed | $242,000 | None Available | |
| Quit Claim Deed | $242,000 | None Available | |
| Quit Claim Deed | -- | -- | |
| Quit Claim Deed | -- | -- | |
| Quit Claim Deed | -- | -- | |
| Deed | $129,900 | -- | |
| Deed | $129,900 | -- | |
| Deed | $85,000 | -- | |
| Deed | $85,000 | -- |
Mortgage History
| Date | Status | Loan Amount | Loan Type |
|---|---|---|---|
| Open | $395,000 | Purchase Money Mortgage | |
| Closed | $395,000 | Purchase Money Mortgage | |
| Closed | $300,000 | Commercial | |
| Previous Owner | $151,000 | New Conventional |
Source: MLS Property Information Network (MLS PIN)
MLS Number: 73448351
APN: SHAD-000040-000018
Disclaimer: Certain information contained herein is derived from information provided by parties other than Homes.com. All information provided is deemed reliable, but is not guaranteed to be accurate and should be independently verified.
![]() The property listing data and information, or the Images, set forth herein were provided to MLS Property Information Network, Inc. from third party sources, including sellers, lessors and public records, and were compiled by MLS Property Information Network, Inc. The property listing data and information, and the Images, are for the personal, non-commercial use of consumers having a good faith interest in purchasing or leasing listed properties of the type displayed to them and may not be used for any purpose other than to identify prospective properties which such consumers may have a good faith interest in purchasing or leasing. MLS Property Information Network, Inc. and its subscribers disclaim any and all representations and warranties as to the accuracy of the property listing data and information, or as to the accuracy of any of the Images, set forth herein.
The property listing data and information, or the Images, set forth herein were provided to MLS Property Information Network, Inc. from third party sources, including sellers, lessors and public records, and were compiled by MLS Property Information Network, Inc. The property listing data and information, and the Images, are for the personal, non-commercial use of consumers having a good faith interest in purchasing or leasing listed properties of the type displayed to them and may not be used for any purpose other than to identify prospective properties which such consumers may have a good faith interest in purchasing or leasing. MLS Property Information Network, Inc. and its subscribers disclaim any and all representations and warranties as to the accuracy of the property listing data and information, or as to the accuracy of any of the Images, set forth herein.
- 75 Pine St
- 88 Alvord St
- 85 Fairview St
- 19 Hildreth Ave
- 108 College St
- 120 Camden St
- 34 Hildreth Ave
- 96 College St
- 4 Sunrise Cir
- 84 Judd Ave
- 19 Hadley St Unit E14
- 17 Woodbridge St
- Lot 1 Edgewater Ln
- Lot 3 Edgewater Ln
- Lot 2 Edgewater Ln
- 70 Lathrop St
- 133 Granby Rd
- 0 Granby Rd
- 41 Woodbridge St
- 540 Granby Rd Unit 72A