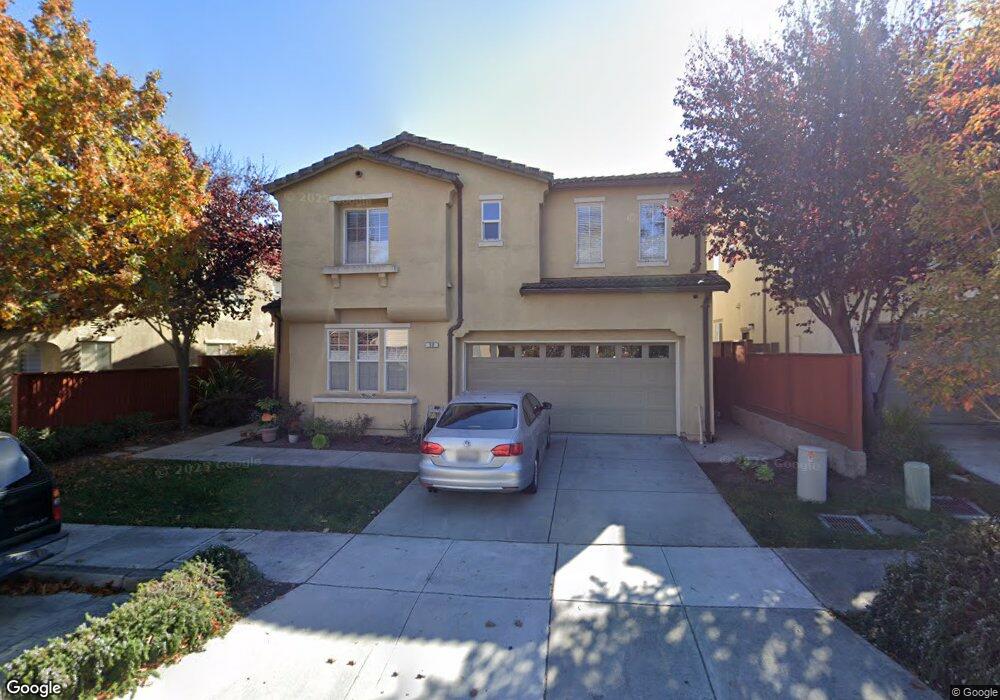
50 Quinta Vista St Watsonville, CA 95076
Estimated Value: $904,000 - $1,063,000
4
Beds
3
Baths
2,694
Sq Ft
$371/Sq Ft
Est. Value
About This Home
This home is located at 50 Quinta Vista St, Watsonville, CA 95076 and is currently estimated at $999,151, approximately $370 per square foot. 50 Quinta Vista St is a home located in Santa Cruz County with nearby schools including Landmark Elementary School, Rolling Hills Middle School, and Pajaro Valley High School.
Ownership History
Date
Name
Owned For
Owner Type
Purchase Details
Closed on
May 9, 2025
Sold by
Monroy Jose C and Tapia Margarita Monroy
Bought by
Margarita And Jose Monroy Living Trust and Monroy-Tapia
Current Estimated Value
Purchase Details
Closed on
Dec 18, 2018
Sold by
Monroy Jose C and Tapia Margarita Monroy
Bought by
Monroy Jose C and Tapia Margarita Monroy
Home Financials for this Owner
Home Financials are based on the most recent Mortgage that was taken out on this home.
Original Mortgage
$309,000
Interest Rate
4.9%
Mortgage Type
New Conventional
Purchase Details
Closed on
Jan 21, 2004
Sold by
Lb/L Duc Ii Franceschi Llc
Bought by
Monroy Jose and Monroy Margarita T
Home Financials for this Owner
Home Financials are based on the most recent Mortgage that was taken out on this home.
Original Mortgage
$429,600
Interest Rate
5.25%
Mortgage Type
New Conventional
Create a Home Valuation Report for This Property
The Home Valuation Report is an in-depth analysis detailing your home's value as well as a comparison with similar homes in the area
Home Values in the Area
Average Home Value in this Area
Purchase History
| Date | Buyer | Sale Price | Title Company |
|---|---|---|---|
| Margarita And Jose Monroy Living Trust | -- | None Listed On Document | |
| Monroy Jose C | -- | First American Title Company | |
| Monroy Jose | $537,000 | -- |
Source: Public Records
Mortgage History
| Date | Status | Borrower | Loan Amount |
|---|---|---|---|
| Previous Owner | Monroy Jose C | $309,000 | |
| Previous Owner | Monroy Jose | $429,600 |
Source: Public Records
Tax History Compared to Growth
Tax History
| Year | Tax Paid | Tax Assessment Tax Assessment Total Assessment is a certain percentage of the fair market value that is determined by local assessors to be the total taxable value of land and additions on the property. | Land | Improvement |
|---|---|---|---|---|
| 2025 | $8,525 | $748,535 | $449,121 | $299,414 |
| 2023 | $8,396 | $719,468 | $431,681 | $287,787 |
| 2022 | $8,249 | $705,362 | $423,217 | $282,145 |
| 2021 | $8,113 | $691,530 | $414,918 | $276,612 |
| 2020 | $7,995 | $684,440 | $410,664 | $273,776 |
| 2019 | $7,853 | $671,020 | $402,612 | $268,408 |
| 2018 | $7,655 | $657,862 | $394,717 | $263,145 |
| 2017 | $7,590 | $644,964 | $386,978 | $257,986 |
| 2016 | $7,222 | $617,798 | $370,679 | $247,119 |
| 2015 | $6,471 | $546,724 | $328,034 | $218,690 |
| 2014 | $5,819 | $492,544 | $295,526 | $197,018 |
Source: Public Records
Map
Nearby Homes
- 130 Skyline Vista Way
- 133 Skyline Vista Way
- 1031 Santa Rosa Ct
- 401 San Luis Ave
- 409 San Luis Ave
- 41 Pelican Dr
- 100 Vista Pointe Dr Unit 602
- 16 Vista Pointe Dr
- 235 Lee Rd
- 127 Terry Loop
- 444 Sherwood Ct
- 1630 W Beach St
- 201 Silver Leaf Dr Unit A
- 99 Sincero Dr Unit 99
- 229 Pacifica Blvd Unit 104
- 66 Contento Dr Unit 66
- 219 2nd St
- 110 Crespi Cir Unit 110
- 30 W Lake Ave
- 8 Kralj Dr
- 54 Quinta Vista St
- 46 Quinta Vista St
- 22 Quinta Vista St
- 18 Quinta Vista St
- 14 Quinta Vista St
- 6 Quinta Vista St
- 2 Quinta Vista St
- 26 Quinta Vista St
- 30 Quinta Vista St
- 29 La Jolla St
- 33 La Jolla St
- 42 Quinta Vista St
- 37 La Jolla St
- 25 La Jolla St
- 58 Quinta Vista St
- 39 Pima St
- 21 La Jolla St
- 41 La Jolla St
- 40 Via Serra St
- 38 Quinta Vista St