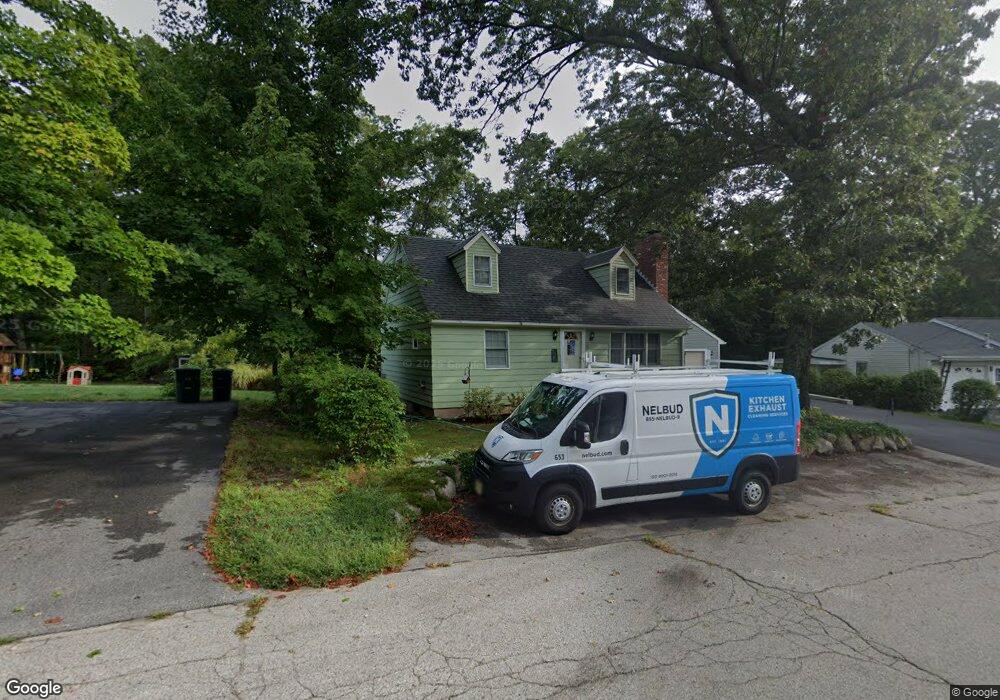
50 Rebecca St Coventry, RI 02816
Estimated Value: $409,871 - $482,000
5
Beds
2
Baths
1,706
Sq Ft
$263/Sq Ft
Est. Value
About This Home
This home is located at 50 Rebecca St, Coventry, RI 02816 and is currently estimated at $448,718, approximately $263 per square foot. 50 Rebecca St is a home located in Kent County with nearby schools including Alan Shawn Feinstein Ms Of Cov, Coventry High School, and St Joseph School.
Ownership History
Date
Name
Owned For
Owner Type
Purchase Details
Closed on
May 19, 2023
Sold by
Carr Patrick H and Carr Teresa D
Bought by
Teresa D & P H Carr Lt and Carr
Current Estimated Value
Purchase Details
Closed on
Jan 11, 1994
Sold by
Patnode Kevin and Patnode Sheila
Bought by
Carr Patrick H and Carr Teresa
Create a Home Valuation Report for This Property
The Home Valuation Report is an in-depth analysis detailing your home's value as well as a comparison with similar homes in the area
Home Values in the Area
Average Home Value in this Area
Purchase History
| Date | Buyer | Sale Price | Title Company |
|---|---|---|---|
| Teresa D & P H Carr Lt | -- | None Available | |
| Carr Patrick H | $120,000 | -- |
Source: Public Records
Mortgage History
| Date | Status | Borrower | Loan Amount |
|---|---|---|---|
| Previous Owner | Carr Patrick H | $100,000 | |
| Previous Owner | Carr Patrick H | $115,000 | |
| Previous Owner | Carr Patrick H | $120,000 | |
| Previous Owner | Carr Patrick H | $77,000 |
Source: Public Records
Tax History Compared to Growth
Tax History
| Year | Tax Paid | Tax Assessment Tax Assessment Total Assessment is a certain percentage of the fair market value that is determined by local assessors to be the total taxable value of land and additions on the property. | Land | Improvement |
|---|---|---|---|---|
| 2024 | $4,638 | $292,800 | $87,300 | $205,500 |
| 2023 | $4,489 | $292,800 | $87,300 | $205,500 |
| 2022 | $4,020 | $205,400 | $85,400 | $120,000 |
| 2021 | $3,985 | $205,400 | $85,400 | $120,000 |
| 2020 | $4,568 | $205,400 | $85,400 | $120,000 |
| 2019 | $3,550 | $159,600 | $65,000 | $94,600 |
| 2018 | $3,449 | $159,600 | $65,000 | $94,600 |
| 2017 | $3,348 | $159,600 | $65,000 | $94,600 |
| 2016 | $3,597 | $168,000 | $63,900 | $104,100 |
| 2015 | $3,499 | $168,000 | $63,900 | $104,100 |
| 2014 | $3,426 | $168,000 | $63,900 | $104,100 |
| 2013 | $3,822 | $204,800 | $86,500 | $118,300 |
Source: Public Records
Map
Nearby Homes