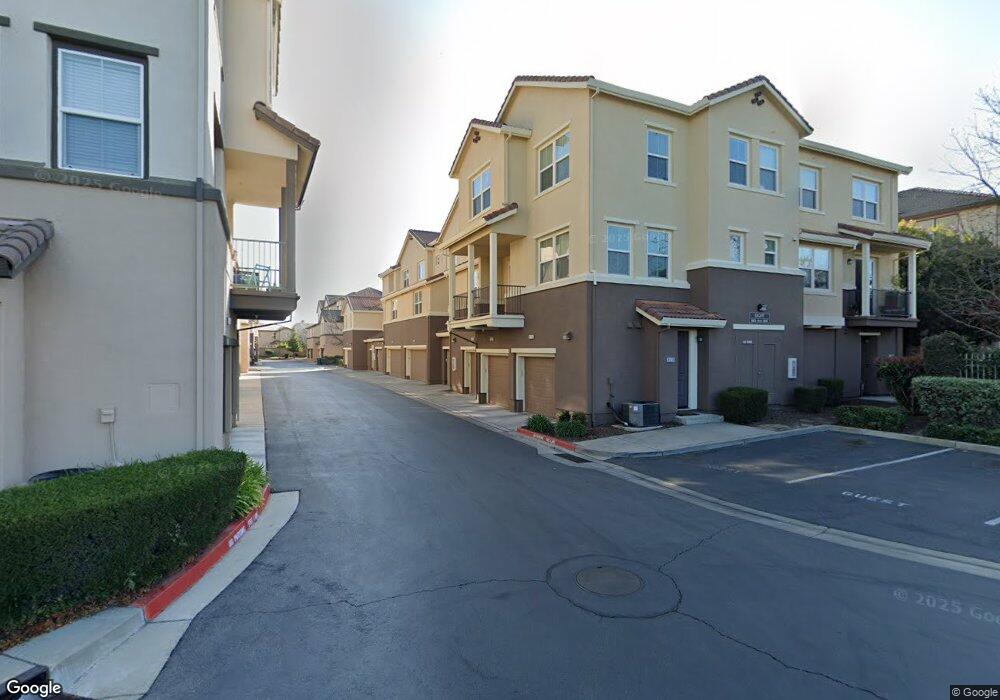
50 Regency Park Cir Unit 86 Sacramento, CA 95835
Village 12 NeighborhoodEstimated Value: $237,000 - $371,493
3
Beds
3
Baths
1,432
Sq Ft
$231/Sq Ft
Est. Value
About This Home
This home is located at 50 Regency Park Cir Unit 86, Sacramento, CA 95835 and is currently estimated at $331,123, approximately $231 per square foot. 50 Regency Park Cir Unit 86 is a home located in Sacramento County with nearby schools including Regency Park Elementary School, Rio Linda Preparatory Academy, and Norwood Junior High School.
Ownership History
Date
Name
Owned For
Owner Type
Purchase Details
Closed on
Mar 24, 2022
Sold by
Huang Jeric Tao
Bought by
Jeric Tao Huang Living Trust
Current Estimated Value
Home Financials for this Owner
Home Financials are based on the most recent Mortgage that was taken out on this home.
Original Mortgage
$280,000
Outstanding Balance
$263,041
Interest Rate
4.42%
Estimated Equity
$68,082
Purchase Details
Closed on
Jul 28, 2011
Sold by
Bank Of America Na
Bought by
Huang Jeric
Purchase Details
Closed on
May 17, 2011
Sold by
Pastor Luis
Bought by
Bank Of America Na
Purchase Details
Closed on
Jul 8, 2008
Sold by
Serenade Associates Lp
Bought by
Kennedy Michael P and Kennedy Pamela C
Purchase Details
Closed on
Dec 26, 2006
Sold by
Pastor Luis
Bought by
Pastor Luis and Pastor Florence
Create a Home Valuation Report for This Property
The Home Valuation Report is an in-depth analysis detailing your home's value as well as a comparison with similar homes in the area
Home Values in the Area
Average Home Value in this Area
Purchase History
| Date | Buyer | Sale Price | Title Company |
|---|---|---|---|
| Jeric Tao Huang Living Trust | -- | Chicago Title | |
| Huang Jeric | $95,000 | Landsafe Title | |
| Bank Of America Na | $109,350 | None Available | |
| Kennedy Michael P | $235,000 | First American Title | |
| Pastor Luis | -- | None Available |
Source: Public Records
Mortgage History
| Date | Status | Borrower | Loan Amount |
|---|---|---|---|
| Open | Jeric Tao Huang Living Trust | $280,000 |
Source: Public Records
Tax History Compared to Growth
Tax History
| Year | Tax Paid | Tax Assessment Tax Assessment Total Assessment is a certain percentage of the fair market value that is determined by local assessors to be the total taxable value of land and additions on the property. | Land | Improvement |
|---|---|---|---|---|
| 2025 | $2,152 | $119,314 | $62,796 | $56,518 |
| 2024 | $2,152 | $116,975 | $61,565 | $55,410 |
| 2023 | $2,158 | $114,682 | $60,358 | $54,324 |
| 2022 | $2,073 | $112,434 | $59,175 | $53,259 |
| 2021 | $2,039 | $110,230 | $58,015 | $52,215 |
| 2020 | $2,022 | $109,101 | $57,421 | $51,680 |
| 2019 | $1,991 | $106,963 | $56,296 | $50,667 |
| 2018 | $1,916 | $104,867 | $55,193 | $49,674 |
| 2017 | $1,948 | $102,811 | $54,111 | $48,700 |
| 2016 | $1,876 | $100,796 | $53,050 | $47,746 |
| 2015 | $1,790 | $99,283 | $52,254 | $47,029 |
| 2014 | $1,809 | $97,339 | $51,231 | $46,108 |
Source: Public Records
Map
Nearby Homes
- 50 Regency Park Cir Unit 11106
- 661 Natalino Cir
- 2001 Club Center Dr Unit 1109
- 2001 Club Center Dr Unit 2107
- 2001 Club Center Dr Unit 1140
- 5330 Alvoca Way
- 5603 Pop Becker Dr
- 1900 Danbrook Dr Unit 521
- 1900 Danbrook Dr Unit 224
- 1900 Danbrook Dr Unit 1415
- 1900 Danbrook Dr Unit 818
- 1900 Danbrook Dr Unit 922
- 5343 Dasco Way
- 1801 Danbrook Dr
- 5115 Nantucket Way
- 5324 Dasco Way
- 2187 Bradburn Dr
- 5727 Honor Pkwy
- 5732 Honor Pkwy
- 2211 Minden Way
- 50 Regency Park Cir Unit 7110
- 50 Regency Park Cir Unit 12106
- 50 Regency Park Cir Unit 1210
- 50 Regency Park Cir Unit 11109
- 50 Regency Park Cir Unit 1810
- 50 Regency Park Cir Unit 9102
- 50 Regency Park Cir Unit 12105
- 50 Regency Park Cir Unit 12107
- 50 Regency Park Cir Unit 8107
- 50 Regency Park Cir Unit 13101
- 50 Regency Park Cir Unit 11107
- 50 Regency Park Cir Unit 10102
- 50 Regency Park Cir Unit 12103
- 50 Regency Park Cir Unit 12108
- 50 Regency Park Cir Unit 1111
- 50 Regency Park Cir Unit 11102
- 50 Regency Park Cir Unit 8102
- 50 Regency Park Cir Unit 9105
- 50 Regency Park Cir Unit 10107
- 50 Regency Park Cir Unit 7109