50 Rockledge Loop Unit 50 Torrington, CT 06790
About This Home
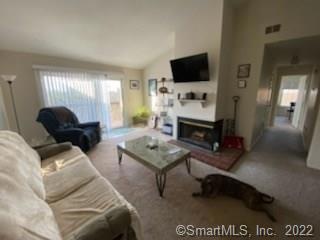
As of April 2022This complex is FHA approved and is right next to the Eastwood Country Club!! Third floor unit. Beautiful westerly views from this 3rd floor ranch style condo. This unit has two nicely sized bedrooms. The master bedroom has an en-suite. Living room with cathedral ceilings and wood burning fireplace opens to the deck great for entertaining and relaxing. Ready to occupy. Had been freshly painted, carpets cleaned not long ago. and ready to go. Spacious unit located in the rear of the complex.Located in Torrington's Eastside and close to many amenities and major routes for commuting. Natural gas heat is super efficient. This condo is move in ready!! Laundry room in unit, and large storage unit in main hallway.
The Fairways is located minutes from major supermarkets, pharmacies, retail stores, breweries, restaurants, theaters and all of the many outdoor activities that the Northwest Corner has to offer. Close to Rte 8 and a 30 min drive to Waterbury, 50 min to Hartford & Danbury, 60 min to the coastline and 32 miles from Great Barrington, MA. Don’t wait!
Co-Listed By
Emily Kores
Turning Point Realty, LLC License #RES.0809917
Property Details
Home Type
- Condominium
Est. Annual Taxes
- $3,068
Year Built
- Built in 1986
Lot Details
- End Unit
HOA Fees
- $265 Monthly HOA Fees
Home Design
- Frame Construction
- Vinyl Siding
Interior Spaces
- 1,095 Sq Ft Home
- 1 Fireplace
Kitchen
- Electric Range
- Range Hood
- Dishwasher
Bedrooms and Bathrooms
- 2 Bedrooms
Utilities
- Cooling System Mounted In Outer Wall Opening
- Heating System Uses Natural Gas
Community Details
Overview
- 10 Units
- Fairways Community
Pet Policy
- Pets Allowed
Ownership History
Purchase Details
Home Financials for this Owner
Home Financials are based on the most recent Mortgage that was taken out on this home.Purchase Details
Home Financials for this Owner
Home Financials are based on the most recent Mortgage that was taken out on this home.Purchase Details
Map
Home Values in the Area
Average Home Value in this Area
Purchase History
| Date | Type | Sale Price | Title Company |
|---|---|---|---|
| Warranty Deed | $109,000 | None Available | |
| Warranty Deed | $131,000 | -- | |
| Warranty Deed | $108,500 | -- |
Mortgage History
| Date | Status | Loan Amount | Loan Type |
|---|---|---|---|
| Open | $27,000 | Stand Alone Refi Refinance Of Original Loan | |
| Open | $105,730 | New Conventional | |
| Previous Owner | $109,840 | FHA | |
| Previous Owner | $127,000 | No Value Available | |
| Previous Owner | $9,200 | No Value Available |
Property History
| Date | Event | Price | Change | Sq Ft Price |
|---|---|---|---|---|
| 04/13/2022 04/13/22 | Sold | $141,000 | +6.1% | $129 / Sq Ft |
| 03/25/2022 03/25/22 | Pending | -- | -- | -- |
| 03/17/2022 03/17/22 | For Sale | $132,900 | +21.9% | $121 / Sq Ft |
| 11/20/2020 11/20/20 | Sold | $109,000 | -2.6% | $100 / Sq Ft |
| 11/01/2020 11/01/20 | Pending | -- | -- | -- |
| 09/01/2020 09/01/20 | Price Changed | $111,900 | -3.5% | $102 / Sq Ft |
| 07/30/2020 07/30/20 | Price Changed | $115,900 | +0.9% | $106 / Sq Ft |
| 07/30/2020 07/30/20 | Price Changed | $114,900 | -4.2% | $105 / Sq Ft |
| 07/10/2020 07/10/20 | For Sale | $119,900 | 0.0% | $109 / Sq Ft |
| 08/26/2019 08/26/19 | Rented | $1,200 | +4.3% | -- |
| 08/24/2019 08/24/19 | Under Contract | -- | -- | -- |
| 07/27/2019 07/27/19 | For Rent | $1,150 | +15.0% | -- |
| 11/30/2013 11/30/13 | Rented | $1,000 | -9.1% | -- |
| 11/30/2013 11/30/13 | Under Contract | -- | -- | -- |
| 10/08/2013 10/08/13 | For Rent | $1,100 | -- | -- |
Tax History
| Year | Tax Paid | Tax Assessment Tax Assessment Total Assessment is a certain percentage of the fair market value that is determined by local assessors to be the total taxable value of land and additions on the property. | Land | Improvement |
|---|---|---|---|---|
| 2024 | $3,187 | $66,440 | $0 | $66,440 |
| 2023 | $3,186 | $66,440 | $0 | $66,440 |
| 2022 | $3,132 | $66,440 | $0 | $66,440 |
| 2021 | $3,068 | $66,440 | $0 | $66,440 |
| 2020 | $3,068 | $66,440 | $0 | $66,440 |
| 2019 | $3,268 | $70,790 | $0 | $70,790 |
| 2018 | $3,268 | $70,790 | $0 | $70,790 |
| 2017 | $3,239 | $70,790 | $0 | $70,790 |
| 2016 | $3,239 | $70,790 | $0 | $70,790 |
| 2015 | $3,239 | $70,790 | $0 | $70,790 |
| 2014 | $3,394 | $93,440 | $0 | $93,440 |
Source: SmartMLS
MLS Number: 170315043
APN: TORR-000236-000005-000003-000050
Disclaimer: Certain information contained herein is derived from information provided by parties other than Homes.com. All information provided is deemed reliable, but is not guaranteed to be accurate and should be independently verified.
![]() IDX information is provided exclusively for personal, non-commercial use, and may not be used for any purpose other than to identify prospective properties consumers may be interested in purchasing. Information is deemed reliable but not guaranteed.
IDX information is provided exclusively for personal, non-commercial use, and may not be used for any purpose other than to identify prospective properties consumers may be interested in purchasing. Information is deemed reliable but not guaranteed.
- 23 Saint Andrews Close
- 117 Tamarack Ct Unit 117
- 108 Berkshire Oval Unit 108
- 110 Berkshire Oval
- 133 Spyglass Ct Unit 133
- 1180 Torringford St
- 1275 Winsted Rd Unit 314
- 1275 Winsted Rd Unit 534
- 1275 Winsted Rd Unit 533
- 212 Wedgewood Dr
- 00 Kennedy Dr
- 1463 Torringford St
- 1846 Torringford St W
- 1683 Torringford St
- 1398 Torringford St
- 25 Ginger Ln
- 95 Lindberg St
- 611 Charles St
- 35 Lindberg St
- 1068 Torringford St