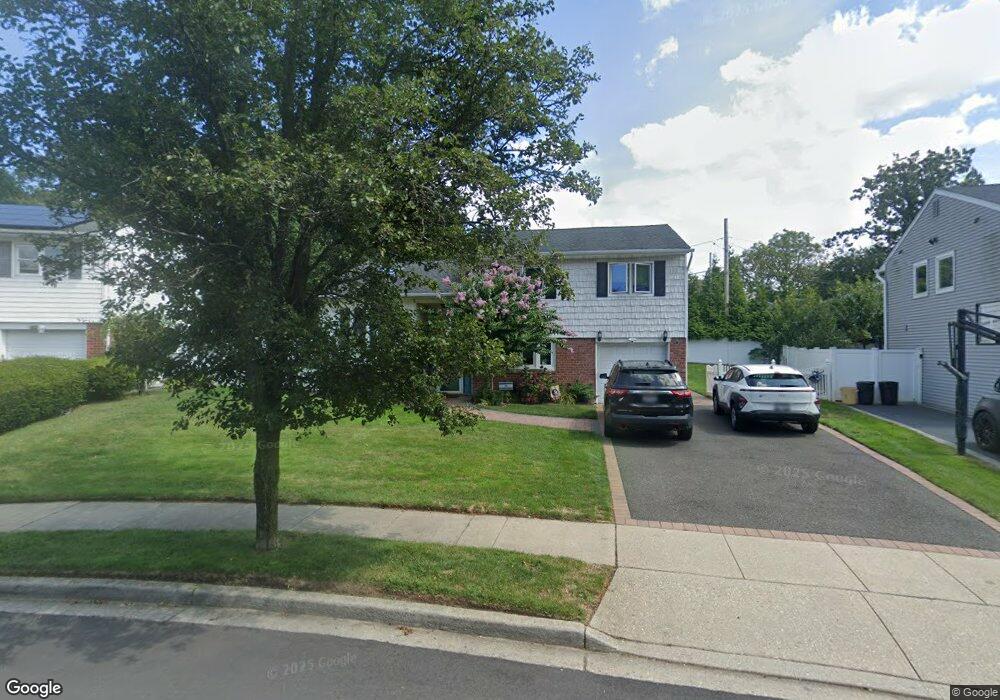
50 Sagamore St Plainview, NY 11803
Estimated Value: $925,000 - $948,610
--
Bed
2
Baths
1,196
Sq Ft
$783/Sq Ft
Est. Value
About This Home
This home is located at 50 Sagamore St, Plainview, NY 11803 and is currently estimated at $936,805, approximately $783 per square foot. 50 Sagamore St is a home located in Nassau County with nearby schools including Judy Jacobs Parkway Elementary School, H B Mattlin Middle School, and Plainview-Old Bethpage John F. Kennedy High School.
Ownership History
Date
Name
Owned For
Owner Type
Purchase Details
Closed on
Oct 1, 2009
Sold by
Lederman Sonia
Bought by
Martin Joseph and Martin Amy
Current Estimated Value
Home Financials for this Owner
Home Financials are based on the most recent Mortgage that was taken out on this home.
Original Mortgage
$477,105
Outstanding Balance
$309,948
Interest Rate
4.98%
Mortgage Type
Purchase Money Mortgage
Estimated Equity
$626,857
Purchase Details
Closed on
Oct 19, 2001
Sold by
Hamlet Olde Oyster Bay Ll
Bought by
Marcovici Robert
Create a Home Valuation Report for This Property
The Home Valuation Report is an in-depth analysis detailing your home's value as well as a comparison with similar homes in the area
Home Values in the Area
Average Home Value in this Area
Purchase History
| Date | Buyer | Sale Price | Title Company |
|---|---|---|---|
| Martin Joseph | $521,400 | -- | |
| Marcovici Robert | $435,000 | Michael Weinstein |
Source: Public Records
Mortgage History
| Date | Status | Borrower | Loan Amount |
|---|---|---|---|
| Open | Martin Joseph | $477,105 |
Source: Public Records
Tax History Compared to Growth
Tax History
| Year | Tax Paid | Tax Assessment Tax Assessment Total Assessment is a certain percentage of the fair market value that is determined by local assessors to be the total taxable value of land and additions on the property. | Land | Improvement |
|---|---|---|---|---|
| 2025 | $16,752 | $564 | $267 | $297 |
| 2024 | $5,271 | $609 | $289 | $320 |
| 2023 | $16,208 | $626 | $297 | $329 |
| 2022 | $16,208 | $658 | $312 | $346 |
| 2021 | $17,369 | $643 | $305 | $338 |
| 2020 | $17,205 | $982 | $745 | $237 |
| 2019 | $17,280 | $982 | $745 | $237 |
| 2018 | $16,199 | $982 | $0 | $0 |
| 2017 | $9,628 | $982 | $670 | $312 |
| 2016 | $14,517 | $982 | $670 | $312 |
| 2015 | $4,901 | $1,092 | $745 | $347 |
| 2014 | $4,901 | $1,092 | $745 | $347 |
| 2013 | $4,464 | $1,092 | $745 | $347 |
Source: Public Records
Map
Nearby Homes