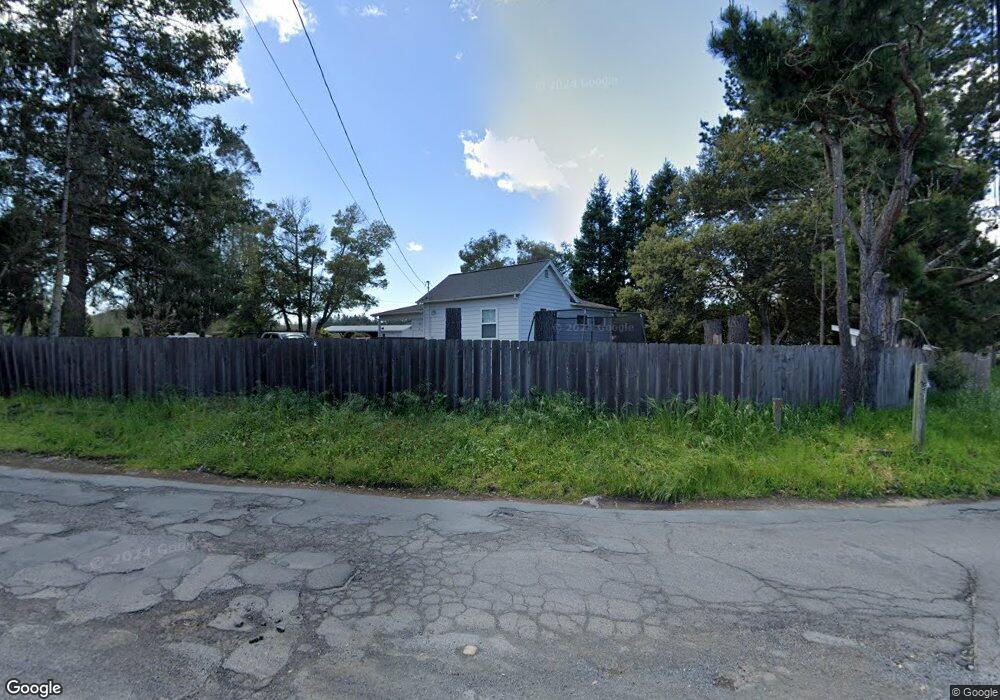
50 Sparkes Rd Sebastopol, CA 95472
Estimated Value: $943,388 - $1,113,000
2
Beds
1
Bath
3,869
Sq Ft
$271/Sq Ft
Est. Value
About This Home
This home is located at 50 Sparkes Rd, Sebastopol, CA 95472 and is currently estimated at $1,046,597, approximately $270 per square foot. 50 Sparkes Rd is a home located in Sonoma County with nearby schools including Analy High School, Sunridge Charter School, and Gravenstein Elementary School.
Ownership History
Date
Name
Owned For
Owner Type
Purchase Details
Closed on
Jun 9, 2009
Sold by
Mosiman Steven T and Mosiman Helen C
Bought by
Mosiman Steven T and Mosiman Helen C
Current Estimated Value
Purchase Details
Closed on
Jul 17, 2008
Sold by
Sheehan Thomas F and Sheehan Susan M
Bought by
Sheehan Thomas F and Sheehan Susan M
Purchase Details
Closed on
Aug 31, 2004
Sold by
Sheehan Thomas F
Bought by
Sheehan Thomas F
Purchase Details
Closed on
Jun 5, 2002
Sold by
Stefenoni Henry and Stefenoni Zola
Bought by
Stefenoni Henry P and Stefenoni Zola L
Purchase Details
Closed on
Aug 22, 2001
Sold by
Henningsen Ralph James and Henningsen Karen L
Bought by
Mosiman Steven T and Mosiman Helen C
Purchase Details
Closed on
Aug 21, 2001
Sold by
Sheehan Jennifer A
Bought by
Sheehan Thomas F
Create a Home Valuation Report for This Property
The Home Valuation Report is an in-depth analysis detailing your home's value as well as a comparison with similar homes in the area
Purchase History
| Date | Buyer | Sale Price | Title Company |
|---|---|---|---|
| Mosiman Steven T | -- | None Available | |
| Sheehan Thomas F | -- | None Available | |
| Sheehan Thomas F | -- | None Available | |
| Sheehan Thomas F | -- | None Available | |
| Sheehan Thomas F | -- | -- | |
| Sheehan Thomas F | -- | -- | |
| Stefenoni Henry P | -- | -- | |
| Mosiman Steven T | $435,000 | Fidelity National Title Co | |
| Sheehan Thomas F | -- | Fidelity National Title Co |
Source: Public Records
Tax History
| Year | Tax Paid | Tax Assessment Tax Assessment Total Assessment is a certain percentage of the fair market value that is determined by local assessors to be the total taxable value of land and additions on the property. | Land | Improvement |
|---|---|---|---|---|
| 2025 | $7,432 | $642,623 | $443,195 | $199,428 |
| 2024 | $7,432 | $630,023 | $434,505 | $195,518 |
| 2023 | $7,432 | $617,671 | $425,986 | $191,685 |
| 2022 | $7,182 | $605,561 | $417,634 | $187,927 |
| 2021 | $7,134 | $593,689 | $409,446 | $184,243 |
| 2020 | $6,469 | $587,602 | $405,248 | $182,354 |
| 2019 | $6,799 | $576,081 | $397,302 | $178,779 |
| 2018 | $6,701 | $564,786 | $389,512 | $175,274 |
| 2017 | $6,415 | $553,713 | $381,875 | $171,838 |
| 2016 | $6,313 | $542,857 | $374,388 | $168,469 |
| 2015 | -- | $534,704 | $368,765 | $165,939 |
| 2014 | -- | $462,000 | $319,000 | $143,000 |
Source: Public Records
Map
Nearby Homes
- 41 Sparkes Rd Unit 8
- 1171 Gravenstein Hwy S
- 447 Sparkes Rd
- 6820 Redwood Ave Unit 63
- 1853 Cooper Rd
- 8061 Elphick Rd
- 1430 Santa Maria Way
- 5301 Gravenstein Hwy S
- 5932 Fredricks Rd
- 486 S Main St
- 6363 Pond Hollow Rd
- 601 Robinson Rd
- 7671 Leland St
- 789 Pleasant Hill Rd
- 5200 California 116
- 7600 Washington Ave
- 7613 Washington Ave
- 375 Florence Ave
- 2485 Sanders Rd
- 455 Florence Ave
- 1418 Gravenstein Hwy S
- 1416 Gravenstein Hwy S
- 6805 Carol Dr
- 6810 Carol Dr
- 6849 Barbara Dr
- 6807 Barbara Dr
- 6780 Carol Dr
- 6773 Carol Dr
- 6816 Barbara Dr
- 6785 Barbara Dr
- 6808 Barbara Dr
- 6750 Carol Dr
- 6757 Barbara Dr
- 6786 Barbara Dr
- 71 Sparkes Rd
- 6754 Barbara Dr
- 95 Sparkes Rd
- 6701 Carol Dr
- 1610 Gravenstein Hwy S
Your Personal Tour Guide
Ask me questions while you tour the home.