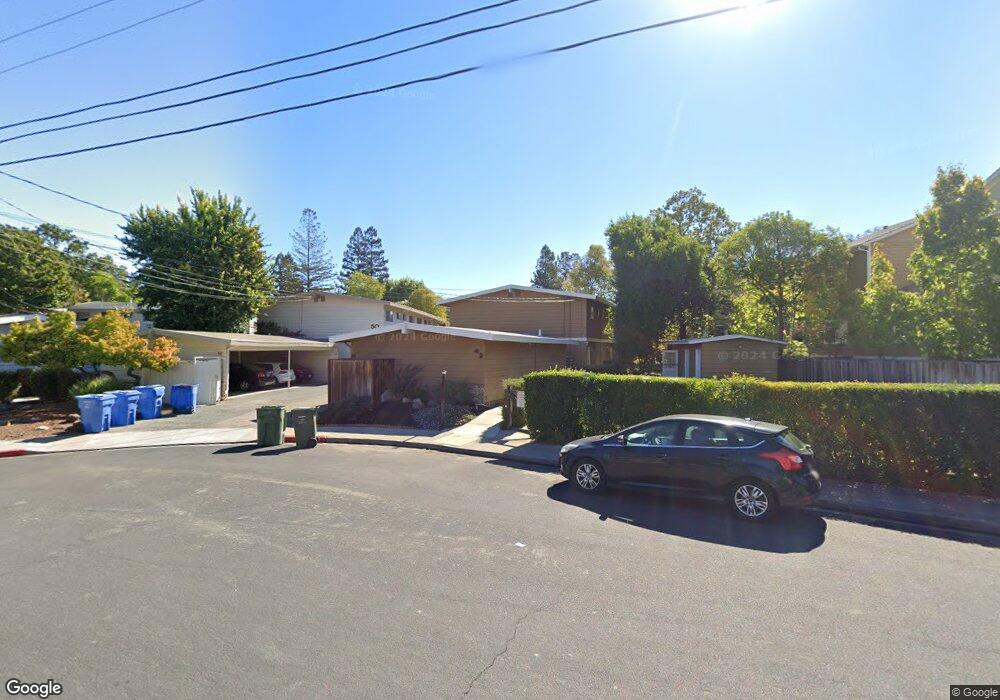
50 Tahoe Ct Unit 1 Walnut Creek, CA 94596
Howe Homestead NeighborhoodEstimated Value: $1,887,000 - $2,231,000
2
Beds
2
Baths
975
Sq Ft
$2,168/Sq Ft
Est. Value
About This Home
This home is located at 50 Tahoe Ct Unit 1, Walnut Creek, CA 94596 and is currently estimated at $2,113,765, approximately $2,167 per square foot. 50 Tahoe Ct Unit 1 is a home located in Contra Costa County with nearby schools including Indian Valley Elementary School, Walnut Creek Intermediate School, and Las Lomas High School.
Ownership History
Date
Name
Owned For
Owner Type
Purchase Details
Closed on
Dec 17, 2019
Sold by
Pisciotta Kathy
Bought by
Pisciotta Chris
Current Estimated Value
Purchase Details
Closed on
Dec 16, 2019
Sold by
Bulloch Susan C and Wong Matthew S
Bought by
Pisciotta Chris
Purchase Details
Closed on
Jan 11, 2010
Sold by
Ngim George and Ngim Betty
Bought by
Bulloch Susan C and Wong Matthew S
Home Financials for this Owner
Home Financials are based on the most recent Mortgage that was taken out on this home.
Original Mortgage
$690,000
Interest Rate
4.68%
Mortgage Type
New Conventional
Purchase Details
Closed on
Jan 7, 2003
Sold by
Ngim George and Ngim Betty
Bought by
Ngim George and Ngim Betty
Home Financials for this Owner
Home Financials are based on the most recent Mortgage that was taken out on this home.
Original Mortgage
$539,000
Interest Rate
6.15%
Mortgage Type
Purchase Money Mortgage
Create a Home Valuation Report for This Property
The Home Valuation Report is an in-depth analysis detailing your home's value as well as a comparison with similar homes in the area
Home Values in the Area
Average Home Value in this Area
Purchase History
| Date | Buyer | Sale Price | Title Company |
|---|---|---|---|
| Pisciotta Chris | -- | Old Republic Title Company | |
| Pisciotta Chris | $1,525,000 | Old Republic Title Company | |
| Bulloch Susan C | $920,000 | First American Title Company | |
| Ngim George | -- | American Title Co | |
| Ngim George | -- | American Title |
Source: Public Records
Mortgage History
| Date | Status | Borrower | Loan Amount |
|---|---|---|---|
| Previous Owner | Bulloch Susan C | $690,000 | |
| Previous Owner | Ngim George | $539,000 |
Source: Public Records
Tax History Compared to Growth
Tax History
| Year | Tax Paid | Tax Assessment Tax Assessment Total Assessment is a certain percentage of the fair market value that is determined by local assessors to be the total taxable value of land and additions on the property. | Land | Improvement |
|---|---|---|---|---|
| 2025 | $21,149 | $1,667,807 | $874,915 | $792,892 |
| 2024 | $20,622 | $1,635,106 | $857,760 | $777,346 |
| 2023 | $20,622 | $1,603,046 | $840,942 | $762,104 |
| 2022 | $20,338 | $1,571,614 | $824,453 | $747,161 |
| 2021 | $19,757 | $1,540,799 | $808,288 | $732,511 |
| 2019 | $14,514 | $1,064,573 | $462,857 | $601,716 |
| 2018 | $14,047 | $1,043,700 | $453,782 | $589,918 |
| 2017 | $13,718 | $1,023,236 | $444,885 | $578,351 |
| 2016 | $13,420 | $1,003,173 | $436,162 | $567,011 |
| 2015 | $13,089 | $988,105 | $429,611 | $558,494 |
| 2014 | $12,896 | $968,750 | $421,196 | $547,554 |
Source: Public Records
Map
Nearby Homes
- 61 Alberta Terrace
- 185 Sierra Dr Unit 314
- 175 Sierra Dr Unit 309
- 1640 San Miguel Dr
- 1236 Walker Ave Unit 101
- 1680 San Miguel Dr
- 1696 San Miguel Dr Unit F9
- 155 Sharene Ln Unit 111
- 289 Sierra Dr
- 150 Sharene Ln Unit 108
- 44 Analisa Ln
- 22 Holcomb Ct Unit 2
- 46 Sierra Ln
- 28 Holcomb Ct
- 1201 Alta Vista Dr Unit 209
- 245 Haleena Place
- 251 Haleena Place
- 249 Haleena Place
- 1611 Carmel Dr
- 1282 Carmel Ct
- 50 Tahoe Ct Unit 2
- 50 Tahoe Ct
- 42 Tahoe Ct Unit 2
- 42 Tahoe Ct
- 1186 Walker Ave
- 1186 Walker Ave
- 1186 Walker Ave Unit 213
- 1186 Walker Ave Unit 223
- 1192 Walker Ave Unit 313
- 1192 Walker Ave
- 1192 Walker Ave
- 1192 Walker Ave Unit 321
- 1192 Walker Ave Unit 322
- 1182 Walker Ave
- 1182 Walker Ave Unit 121
- 1182 Walker Ave Unit 122
- 45 Tahoe Ct Unit 6
- 45 Tahoe Ct
- 45 Tahoe Ct Unit 5
- 45 Tahoe Ct Unit 4