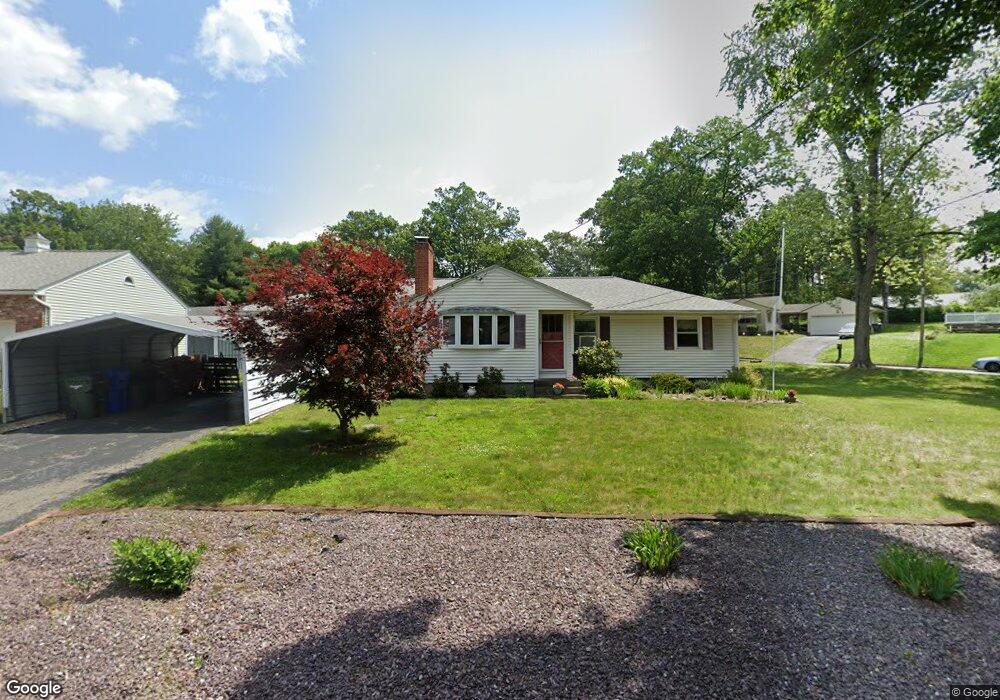
50 Talbot Rd Springfield, MA 01119
Sixteen Acres NeighborhoodEstimated Value: $301,371 - $344,000
3
Beds
1
Bath
1,040
Sq Ft
$309/Sq Ft
Est. Value
About This Home
This home is located at 50 Talbot Rd, Springfield, MA 01119 and is currently estimated at $321,343, approximately $308 per square foot. 50 Talbot Rd is a home located in Hampden County with nearby schools including Glickman Elementary, John J Duggan Middle, and Springfield High School of Science and Technology.
Ownership History
Date
Name
Owned For
Owner Type
Purchase Details
Closed on
Mar 29, 2022
Sold by
Richard Constance M
Bought by
Richard Paul R and Richard Constance M
Current Estimated Value
Purchase Details
Closed on
Apr 29, 1992
Sold by
Beeman Judith A
Bought by
Richard Paul R and Richard Constance
Home Financials for this Owner
Home Financials are based on the most recent Mortgage that was taken out on this home.
Original Mortgage
$47,000
Interest Rate
8.96%
Mortgage Type
Purchase Money Mortgage
Create a Home Valuation Report for This Property
The Home Valuation Report is an in-depth analysis detailing your home's value as well as a comparison with similar homes in the area
Home Values in the Area
Average Home Value in this Area
Purchase History
| Date | Buyer | Sale Price | Title Company |
|---|---|---|---|
| Richard Paul R | -- | None Available | |
| Richard Paul R | $103,000 | -- |
Source: Public Records
Mortgage History
| Date | Status | Borrower | Loan Amount |
|---|---|---|---|
| Previous Owner | Richard Paul R | $47,000 |
Source: Public Records
Tax History
| Year | Tax Paid | Tax Assessment Tax Assessment Total Assessment is a certain percentage of the fair market value that is determined by local assessors to be the total taxable value of land and additions on the property. | Land | Improvement |
|---|---|---|---|---|
| 2025 | $4,188 | $267,100 | $53,800 | $213,300 |
| 2024 | $3,848 | $239,600 | $53,800 | $185,800 |
| 2023 | $3,632 | $213,000 | $51,200 | $161,800 |
| 2022 | $3,687 | $195,900 | $51,200 | $144,700 |
| 2021 | $3,277 | $173,400 | $46,500 | $126,900 |
| 2020 | $3,402 | $174,200 | $46,500 | $127,700 |
| 2019 | $3,170 | $161,100 | $46,500 | $114,600 |
| 2018 | $2,983 | $151,600 | $46,500 | $105,100 |
| 2017 | $2,955 | $150,300 | $43,200 | $107,100 |
| 2016 | $2,776 | $141,200 | $43,200 | $98,000 |
| 2015 | $2,699 | $137,200 | $43,200 | $94,000 |
Source: Public Records
Map
Nearby Homes
- 108 Birchland Ave
- 55 Old Farm Rd
- 73 Timber Ln
- 46 Puritan Cir
- 74 Valley Rd
- 744 Bradley Rd
- 86 Wildwood Ave
- 81 W Crystal Brook Dr
- Lot 37 Kane St
- 119 Acrebrook Rd
- 120 Bridle Path Rd
- 381 N Brook Rd
- 647 Plumtree Rd
- 228 Acrebrook Rd
- 30 W Hill Rd
- 88 Senator St
- 24 Wands St
- 101 Regal St
- 60 Jeanne Marie St
- 85 Talmadge Dr
Your Personal Tour Guide
Ask me questions while you tour the home.