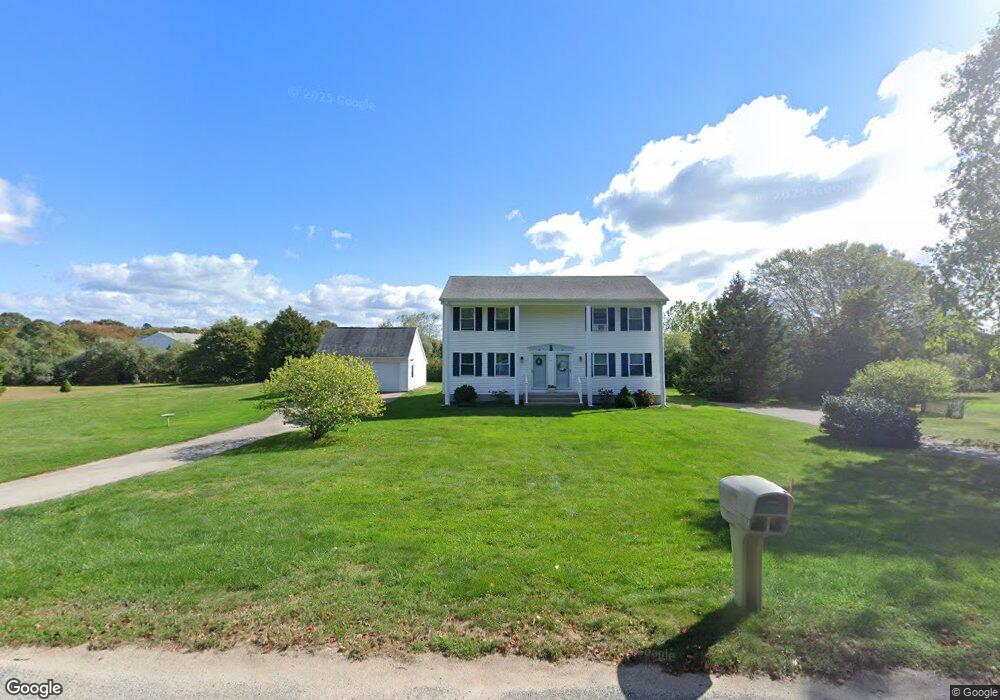
50 Tockwotten Cove Rd Charlestown, RI 02813
Estimated Value: $445,006 - $505,000
4
Beds
4
Baths
3,000
Sq Ft
$156/Sq Ft
Est. Value
About This Home
This home is located at 50 Tockwotten Cove Rd, Charlestown, RI 02813 and is currently estimated at $469,002, approximately $156 per square foot. 50 Tockwotten Cove Rd is a home located in Washington County with nearby schools including Chariho Regional Middle School and Chariho High School.
Ownership History
Date
Name
Owned For
Owner Type
Purchase Details
Closed on
Jun 23, 2025
Sold by
Connery Michael J and Kerr Eryn S
Bought by
M T & Lori L Eldridge Lt
Current Estimated Value
Purchase Details
Closed on
Aug 23, 2019
Sold by
Dandurand Peter P
Bought by
Kerr Eryn S and Connery Michael J
Home Financials for this Owner
Home Financials are based on the most recent Mortgage that was taken out on this home.
Original Mortgage
$248,234
Interest Rate
3.7%
Mortgage Type
New Conventional
Purchase Details
Closed on
Apr 30, 2018
Sold by
Linnea-Daniels Jane
Bought by
Dandurand Peter P
Home Financials for this Owner
Home Financials are based on the most recent Mortgage that was taken out on this home.
Original Mortgage
$190,000
Interest Rate
4.44%
Mortgage Type
New Conventional
Purchase Details
Closed on
May 19, 1997
Sold by
Beechwood Enterprises
Bought by
Fortier Charles P and Fortier Ruth
Create a Home Valuation Report for This Property
The Home Valuation Report is an in-depth analysis detailing your home's value as well as a comparison with similar homes in the area
Home Values in the Area
Average Home Value in this Area
Purchase History
| Date | Buyer | Sale Price | Title Company |
|---|---|---|---|
| M T & Lori L Eldridge Lt | $459,900 | None Available | |
| M T & Lori L Eldridge Lt | $459,900 | None Available | |
| Kerr Eryn S | $285,000 | -- | |
| Kerr Eryn S | $285,000 | -- | |
| Dandurand Peter P | $190,000 | -- | |
| Dandurand Peter P | $190,000 | -- | |
| Fortier Charles P | $92,500 | -- | |
| Fortier Charles P | $92,500 | -- |
Source: Public Records
Mortgage History
| Date | Status | Borrower | Loan Amount |
|---|---|---|---|
| Previous Owner | Kerr Eryn S | $248,234 | |
| Previous Owner | Dandurand Peter P | $190,000 |
Source: Public Records
Tax History Compared to Growth
Tax History
| Year | Tax Paid | Tax Assessment Tax Assessment Total Assessment is a certain percentage of the fair market value that is determined by local assessors to be the total taxable value of land and additions on the property. | Land | Improvement |
|---|---|---|---|---|
| 2025 | $2,134 | $359,800 | $0 | $359,800 |
| 2024 | $2,080 | $359,800 | $0 | $359,800 |
| 2023 | $2,065 | $359,800 | $0 | $359,800 |
| 2022 | $2,137 | $261,600 | $0 | $261,600 |
| 2021 | $2,140 | $261,600 | $0 | $261,600 |
| 2020 | $2,153 | $261,600 | $0 | $261,600 |
| 2019 | $2,010 | $217,800 | $0 | $217,800 |
| 2018 | $1,980 | $205,400 | $0 | $205,400 |
| 2017 | $1,970 | $205,400 | $0 | $205,400 |
| 2016 | $2,097 | $205,400 | $0 | $205,400 |
| 2015 | $2,077 | $205,400 | $0 | $205,400 |
| 2014 | $2,033 | $205,400 | $0 | $205,400 |
Source: Public Records
Map
Nearby Homes
- 49 West Way
- 0 Falcone Ln
- 21 Browning Dr
- 4459 Old Post Rd
- 130 Pequot Dr
- 130 S Niantic Dr
- 14 Lakeside Dr
- 16 Center St
- 15 Charlestown Rd
- 14 Charlestown Rd
- 350 Narrow Ln
- 19 W Spruce St
- 4960 S County Trail
- 19 Traymore St
- 150 Southern Way
- 45 Elizabeth Cooper Dr
- 15 Josephine Dr
- 63 Aspen Rd
- 10 Josephine Dr Unit 2D
- 40 Alder Rd
- 50 Tockwotten Cove Rd Unit 3-1
- 52 Tockwotten Cove Rd
- 45 Tockwotten Cove Rd Unit 12
- 72 Tockwotten Cove Rd
- 70 Tockwotten Cove Rd
- 70 Tockwotten Cove Rd Unit 70
- 70 Tockwotten Cove Rd Unit 4
- 42 Tockwotten Cove Rd
- 40 Tockwotten Cove Rd
- 39 Johnson Ln
- 92 Tockwotten Cove Rd
- 90 Tockwotten Cove Rd
- 6 Tockwotten Cove (Lot 24-6 ) Rd
- 25 Maritime Dr Unit D
- 25 Maritime Dr Unit C
- 25 Maritime Dr Unit B
- 25 Maritime Dr Unit A
- 25 Maritime Dr Unit 4
- 25 Maritime Dr
- 25 Maritime Dr Unit 25A