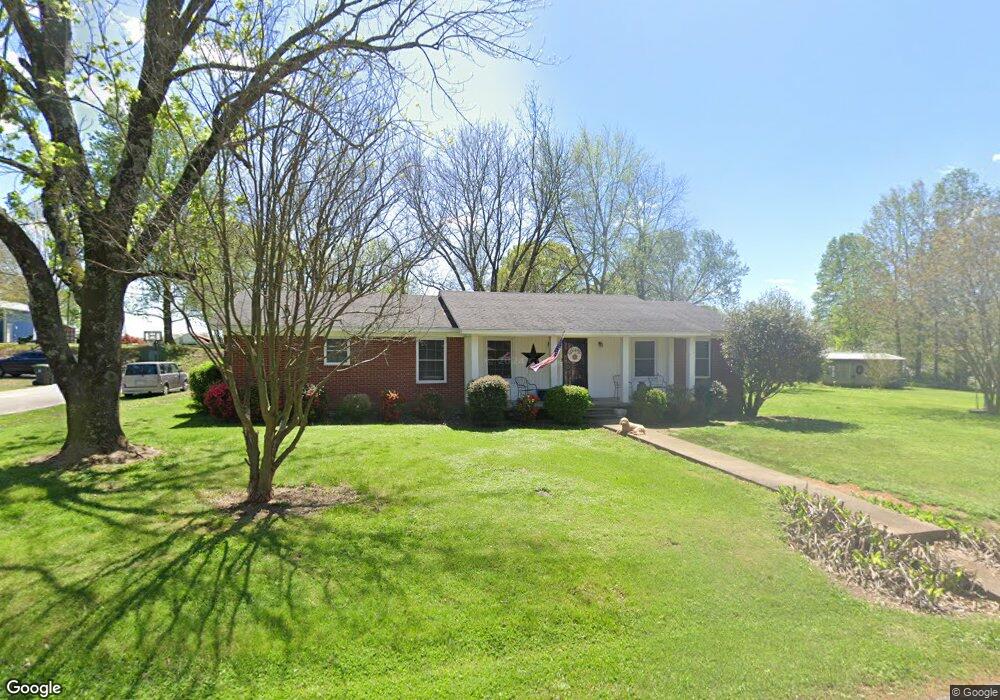
50 Walnut St Atwood, TN 38220
Estimated Value: $135,515 - $211,000
3
Beds
2
Baths
1,647
Sq Ft
$110/Sq Ft
Est. Value
About This Home
This home is located at 50 Walnut St, Atwood, TN 38220 and is currently estimated at $181,629, approximately $110 per square foot. 50 Walnut St is a home located in Carroll County with nearby schools including West Carroll Primary School, West Carroll Elementary School, and West Carroll Junior/Senior High School.
Ownership History
Date
Name
Owned For
Owner Type
Purchase Details
Closed on
Sep 5, 2014
Sold by
Newsome John T
Bought by
Stout Tammy and Stout Jeffrey
Current Estimated Value
Home Financials for this Owner
Home Financials are based on the most recent Mortgage that was taken out on this home.
Original Mortgage
$84,693
Outstanding Balance
$64,981
Interest Rate
4.2%
Mortgage Type
Cash
Estimated Equity
$116,648
Purchase Details
Closed on
Aug 20, 2013
Sold by
Chandler Phyllis
Bought by
Newsome John T and Newsome Judi A
Home Financials for this Owner
Home Financials are based on the most recent Mortgage that was taken out on this home.
Original Mortgage
$71,000
Interest Rate
4.31%
Mortgage Type
Cash
Purchase Details
Closed on
Oct 13, 2004
Sold by
Clark Alton P
Bought by
Clark Alton P
Purchase Details
Closed on
Oct 14, 1967
Bought by
Clark Alton P and Clark Edna
Create a Home Valuation Report for This Property
The Home Valuation Report is an in-depth analysis detailing your home's value as well as a comparison with similar homes in the area
Home Values in the Area
Average Home Value in this Area
Purchase History
| Date | Buyer | Sale Price | Title Company |
|---|---|---|---|
| Stout Tammy | $83,000 | -- | |
| Newsome John T | $76,000 | -- | |
| Clark Alton P | -- | -- | |
| Clark Alton P | -- | -- |
Source: Public Records
Mortgage History
| Date | Status | Borrower | Loan Amount |
|---|---|---|---|
| Open | Stout Tammy | $84,693 | |
| Previous Owner | Newsome John T | $71,000 |
Source: Public Records
Tax History Compared to Growth
Tax History
| Year | Tax Paid | Tax Assessment Tax Assessment Total Assessment is a certain percentage of the fair market value that is determined by local assessors to be the total taxable value of land and additions on the property. | Land | Improvement |
|---|---|---|---|---|
| 2024 | -- | $23,750 | $1,625 | $22,125 |
| 2023 | $626 | $23,750 | $1,625 | $22,125 |
| 2022 | $626 | $23,750 | $1,625 | $22,125 |
| 2021 | $336 | $23,750 | $1,625 | $22,125 |
| 2020 | $626 | $23,750 | $1,625 | $22,125 |
| 2019 | $669 | $23,075 | $1,625 | $21,450 |
| 2018 | $669 | $23,075 | $1,625 | $21,450 |
| 2017 | $669 | $23,075 | $1,625 | $21,450 |
| 2016 | $980 | $23,075 | $1,625 | $21,450 |
| 2015 | $692 | $23,075 | $1,625 | $21,450 |
| 2014 | $603 | $23,075 | $1,625 | $21,450 |
| 2013 | $603 | $19,516 | $0 | $0 |
Source: Public Records
Map
Nearby Homes
- 13820 Church St
- 1205 W Main St
- 1150 W Main St
- 110 Glover St
- 120 Glover St
- 250 Glover St
- 160 Peggy Ln
- 3945 Old Trezevant Rd
- 3420 Highway 79 Ln
- 0 Old Trezevant Rd
- 215 Front St
- 5610 Main St E
- 00 Clearview Ave
- 145 Skyline Dr
- 3310 Republican Grove Rd
- 6430 Broad St N
- 5987 Creekside Dr
- 87 Gann Rd
- 0 Herbert Neal Rd
- 3064 Algee Ln