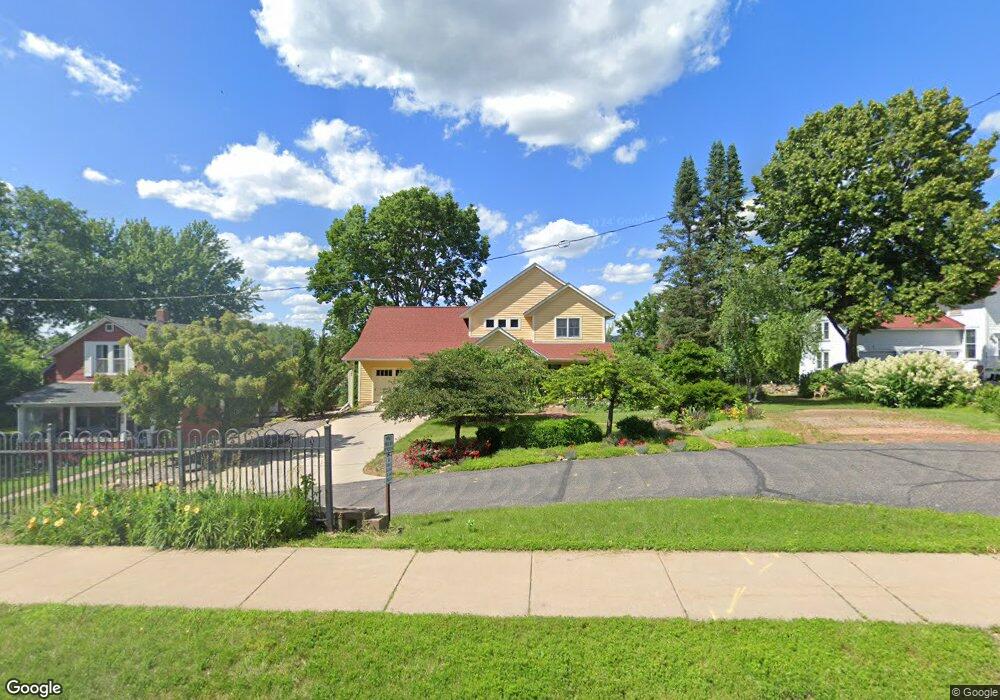
500 2nd St W Hastings, MN 55033
Hastings-Marshan Township NeighborhoodEstimated Value: $375,000 - $414,793
2
Beds
2
Baths
1,820
Sq Ft
$217/Sq Ft
Est. Value
About This Home
This home is located at 500 2nd St W, Hastings, MN 55033 and is currently estimated at $394,948, approximately $217 per square foot. 500 2nd St W is a home located in Dakota County with nearby schools including Hastings Middle School, Christa Mcauliffe Elementary School, and Hastings High School.
Ownership History
Date
Name
Owned For
Owner Type
Purchase Details
Closed on
Nov 28, 2003
Sold by
Ries Richard and Ries Bonnie
Bought by
Langenfeld Robert and Langenfeld Adelheid
Current Estimated Value
Purchase Details
Closed on
Aug 21, 2000
Sold by
Denn Kathleen E and Huppert Jean M
Bought by
Denn Terry Michael
Purchase Details
Closed on
Jun 3, 1993
Sold by
Kerstetter Joanne
Bought by
Huppert Jean M and Denn Kathleen
Create a Home Valuation Report for This Property
The Home Valuation Report is an in-depth analysis detailing your home's value as well as a comparison with similar homes in the area
Home Values in the Area
Average Home Value in this Area
Purchase History
| Date | Buyer | Sale Price | Title Company |
|---|---|---|---|
| Langenfeld Robert | $100,000 | -- | |
| Denn Terry Michael | $28,000 | -- | |
| Huppert Jean M | $28,000 | -- |
Source: Public Records
Mortgage History
| Date | Status | Borrower | Loan Amount |
|---|---|---|---|
| Closed | Huppert Jean M | -- |
Source: Public Records
Tax History Compared to Growth
Tax History
| Year | Tax Paid | Tax Assessment Tax Assessment Total Assessment is a certain percentage of the fair market value that is determined by local assessors to be the total taxable value of land and additions on the property. | Land | Improvement |
|---|---|---|---|---|
| 2024 | $4,560 | $391,700 | $90,400 | $301,300 |
| 2023 | $4,316 | $396,100 | $90,500 | $305,600 |
| 2022 | $3,800 | $386,500 | $90,300 | $296,200 |
| 2021 | $3,602 | $315,800 | $78,500 | $237,300 |
| 2020 | $3,704 | $298,800 | $74,800 | $224,000 |
| 2019 | $3,610 | $297,100 | $71,200 | $225,900 |
| 2018 | $3,403 | $276,800 | $67,800 | $209,000 |
| 2017 | $3,112 | $254,600 | $64,600 | $190,000 |
| 2016 | $3,182 | $234,400 | $60,400 | $174,000 |
| 2015 | $3,084 | $217,384 | $54,532 | $162,852 |
| 2014 | -- | $211,825 | $52,284 | $159,541 |
| 2013 | -- | $178,362 | $46,078 | $132,284 |
Source: Public Records
Map
Nearby Homes