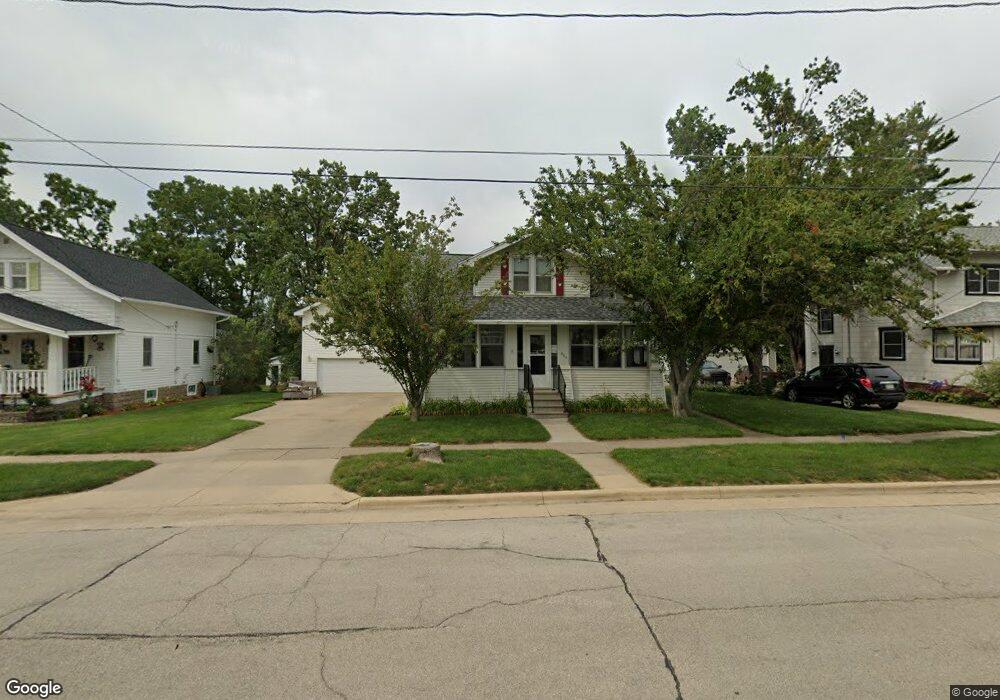
500 6th Ave Marion, IA 52302
Estimated Value: $182,000 - $212,055
3
Beds
1
Bath
1,238
Sq Ft
$154/Sq Ft
Est. Value
About This Home
This home is located at 500 6th Ave, Marion, IA 52302 and is currently estimated at $190,514, approximately $153 per square foot. 500 6th Ave is a home located in Linn County with nearby schools including Francis Marion Intermediate School, Vernon Middle School, and Marion High School.
Ownership History
Date
Name
Owned For
Owner Type
Purchase Details
Closed on
Aug 15, 2022
Sold by
Dale Hegland Robert
Bought by
Hegland Linda Ann
Current Estimated Value
Purchase Details
Closed on
Aug 21, 2002
Sold by
Moore Martin A and Moore Cathleen
Bought by
Hegland Robert D and Hegland Linda A
Home Financials for this Owner
Home Financials are based on the most recent Mortgage that was taken out on this home.
Original Mortgage
$94,400
Interest Rate
6.56%
Create a Home Valuation Report for This Property
The Home Valuation Report is an in-depth analysis detailing your home's value as well as a comparison with similar homes in the area
Home Values in the Area
Average Home Value in this Area
Purchase History
| Date | Buyer | Sale Price | Title Company |
|---|---|---|---|
| Hegland Linda Ann | -- | Murray Law Firm Pc | |
| Hegland Robert D | $117,500 | -- |
Source: Public Records
Mortgage History
| Date | Status | Borrower | Loan Amount |
|---|---|---|---|
| Previous Owner | Hegland Robert D | $94,400 |
Source: Public Records
Tax History
| Year | Tax Paid | Tax Assessment Tax Assessment Total Assessment is a certain percentage of the fair market value that is determined by local assessors to be the total taxable value of land and additions on the property. | Land | Improvement |
|---|---|---|---|---|
| 2025 | $3,706 | $231,800 | $18,300 | $213,500 |
| 2024 | $3,060 | $207,900 | $18,300 | $189,600 |
| 2023 | $3,060 | $207,900 | $18,300 | $189,600 |
| 2022 | $3,058 | $146,400 | $18,300 | $128,100 |
| 2021 | $3,012 | $151,200 | $18,300 | $132,900 |
| 2020 | $3,012 | $141,800 | $18,300 | $123,500 |
| 2019 | $3,042 | $143,500 | $22,400 | $121,100 |
Source: Public Records
Map
Nearby Homes
Your Personal Tour Guide
Ask me questions while you tour the home.