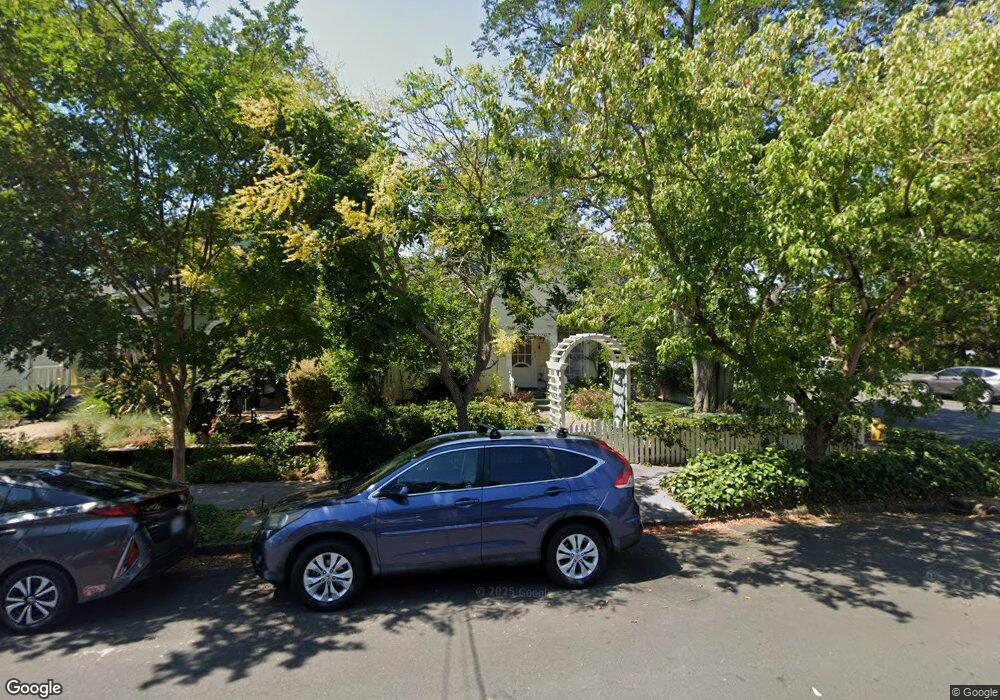
500 7th St Petaluma, CA 94952
Western Petaluma NeighborhoodEstimated Value: $684,902 - $1,094,000
2
Beds
1
Bath
1,707
Sq Ft
$502/Sq Ft
Est. Value
About This Home
This home is located at 500 7th St, Petaluma, CA 94952 and is currently estimated at $857,226, approximately $502 per square foot. 500 7th St is a home located in Sonoma County with nearby schools including McNear Elementary School, Petaluma Junior High School, and Petaluma High School.
Ownership History
Date
Name
Owned For
Owner Type
Purchase Details
Closed on
Sep 17, 2016
Sold by
Rose Jennifer Sue
Bought by
Rose Jennifer S and Jennifer S Rose Trust
Current Estimated Value
Purchase Details
Closed on
Sep 20, 2000
Sold by
Rose Robert J and Rose Joan E
Bought by
Rose Jennifer Sue
Purchase Details
Closed on
May 15, 1992
Bought by
Rose Jennifer S Tr
Create a Home Valuation Report for This Property
The Home Valuation Report is an in-depth analysis detailing your home's value as well as a comparison with similar homes in the area
Home Values in the Area
Average Home Value in this Area
Purchase History
| Date | Buyer | Sale Price | Title Company |
|---|---|---|---|
| Rose Jennifer S | -- | None Available | |
| Rose Jennifer Sue | -- | -- | |
| Rose Jennifer S Tr | $178,500 | -- | |
| Rose Jennifer S Tr | $178,500 | -- |
Source: Public Records
Tax History
| Year | Tax Paid | Tax Assessment Tax Assessment Total Assessment is a certain percentage of the fair market value that is determined by local assessors to be the total taxable value of land and additions on the property. | Land | Improvement |
|---|---|---|---|---|
| 2025 | $3,203 | $309,906 | $173,617 | $136,289 |
| 2024 | $3,203 | $303,830 | $170,213 | $133,617 |
| 2023 | $3,203 | $297,874 | $166,876 | $130,998 |
| 2022 | $3,260 | $292,034 | $163,604 | $128,430 |
| 2021 | $3,199 | $286,309 | $160,397 | $125,912 |
| 2020 | $3,225 | $283,374 | $158,753 | $124,621 |
| 2019 | $3,185 | $277,819 | $155,641 | $122,178 |
| 2018 | $3,172 | $272,373 | $152,590 | $119,783 |
| 2017 | $3,106 | $267,034 | $149,599 | $117,435 |
| 2016 | $3,026 | $261,799 | $146,666 | $115,133 |
| 2015 | $2,984 | $257,867 | $144,463 | $113,404 |
| 2014 | $2,969 | $252,817 | $141,634 | $111,183 |
Source: Public Records
Map
Nearby Homes
Your Personal Tour Guide
Ask me questions while you tour the home.