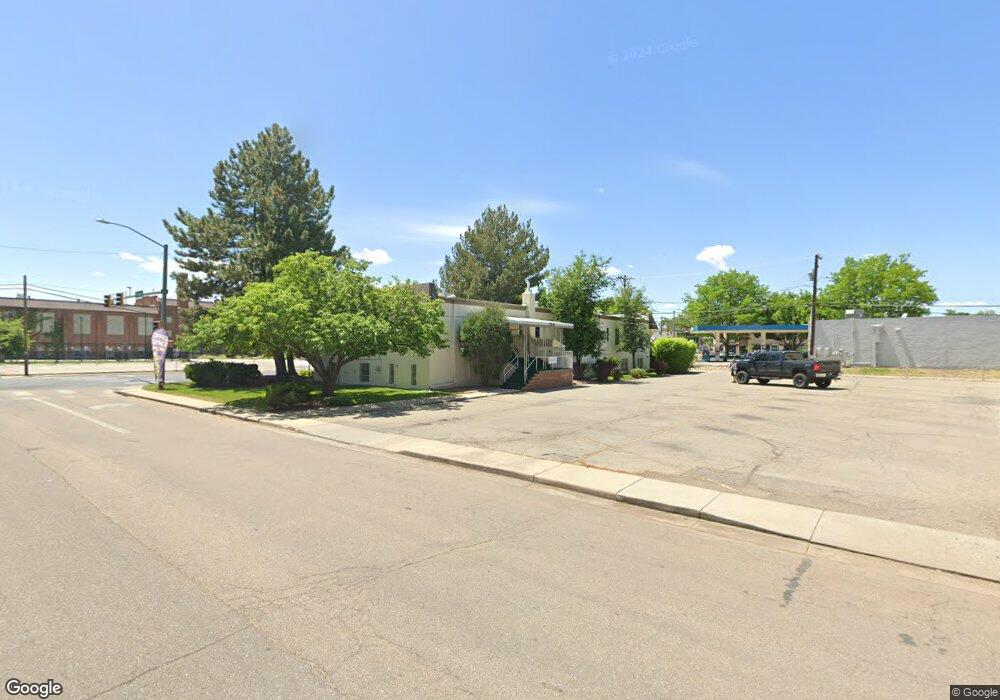
500 9th Ave Longmont, CO 80501
Business District Neighborhood
Studio
--
Bath
8,143
Sq Ft
17,860
Sq Ft Lot
About This Home
This home is located at 500 9th Ave, Longmont, CO 80501. 500 9th Ave is a home located in Boulder County with nearby schools including Columbine Elementary School, Trail Ridge Middle School, and Skyline High School.
Ownership History
Date
Name
Owned For
Owner Type
Purchase Details
Closed on
Dec 5, 2018
Sold by
Walker Rex Ross
Bought by
Kimback Llc
Purchase Details
Closed on
Jul 19, 2016
Sold by
Kimbark Llc
Bought by
Walker Rex Ross
Purchase Details
Closed on
Feb 7, 2012
Sold by
The Fred K Bishop Gst Exempt Trust
Bought by
Kimbark Llc
Purchase Details
Closed on
Dec 19, 2011
Sold by
Walker Rex Ross
Bought by
The Freda K Bishop Gst Exempt Trust
Purchase Details
Closed on
Dec 16, 2010
Sold by
Dawson Janice R
Bought by
Walker Rex Ross
Home Financials for this Owner
Home Financials are based on the most recent Mortgage that was taken out on this home.
Original Mortgage
$206,250
Interest Rate
4.41%
Mortgage Type
Commercial
Purchase Details
Closed on
Oct 26, 2009
Sold by
Dawson Janice R and Estate Of Margaret C Johnson
Bought by
Dawson Janice R
Purchase Details
Closed on
May 25, 1999
Sold by
Johnson Margaret C
Bought by
Dawson Janice R
Purchase Details
Closed on
Oct 4, 1990
Bought by
Walker Rex Ross
Purchase Details
Closed on
Nov 5, 1984
Bought by
Walker Rex Ross
Purchase Details
Closed on
Mar 10, 1972
Bought by
Walker Rex Ross
Create a Home Valuation Report for This Property
The Home Valuation Report is an in-depth analysis detailing your home's value as well as a comparison with similar homes in the area
Home Values in the Area
Average Home Value in this Area
Purchase History
| Date | Buyer | Sale Price | Title Company |
|---|---|---|---|
| Kimback Llc | -- | None Available | |
| Walker Rex Ross | $125,000 | None Available | |
| Kimbark Llc | -- | None Available | |
| The Freda K Bishop Gst Exempt Trust | -- | None Available | |
| Walker Rex Ross | $91,666 | Fidelity National Title Insu | |
| Walker Rex Ross | $91,666 | Fidelity National Title Insu | |
| Walker Rex Ross | $91,666 | Fidelity National Title Insu | |
| Dawson Janice R | -- | None Available | |
| Dawson Janice R | -- | None Available | |
| Walker Rex Ross | -- | -- | |
| Walker Rex Ross | $235,000 | -- | |
| Walker Rex Ross | $80,000 | -- |
Source: Public Records
Mortgage History
| Date | Status | Borrower | Loan Amount |
|---|---|---|---|
| Previous Owner | Walker Rex Ross | $206,250 |
Source: Public Records
Tax History
| Year | Tax Paid | Tax Assessment Tax Assessment Total Assessment is a certain percentage of the fair market value that is determined by local assessors to be the total taxable value of land and additions on the property. | Land | Improvement |
|---|---|---|---|---|
| 2025 | $27,462 | $276,399 | $115,614 | $160,785 |
| 2024 | $27,462 | $276,399 | $115,614 | $160,785 |
| 2023 | $27,087 | $287,091 | $121,309 | $174,152 |
| 2022 | $19,313 | $195,170 | $93,960 | $101,210 |
| 2021 | $19,016 | $195,170 | $93,960 | $101,210 |
| 2020 | $18,761 | $193,140 | $93,960 | $99,180 |
| 2019 | $18,466 | $193,140 | $93,960 | $99,180 |
| 2018 | $12,742 | $134,143 | $51,510 | $82,633 |
| 2017 | $12,569 | $134,143 | $51,510 | $82,633 |
| 2016 | $9,159 | $95,816 | $28,745 | $67,071 |
| 2015 | $8,728 | $85,550 | $63,481 | $22,069 |
| 2014 | $7,991 | $85,550 | $63,481 | $22,069 |
Source: Public Records
Map
Nearby Homes
- 824 Kimbark St
- 820 Kimbark St Unit B
- 1117 Collyer St
- 1117 Atwood St
- 832 Gay St
- 845 Martin St
- 619 Pratt St
- 10 9th Ave Unit 18
- 1230 Emery St
- 1232 Emery St
- 830 Martin St
- 1219 Atwood St
- 536 Atwood St
- 725 Gay St
- 1225 Baker St
- 400 Emery St Unit 202
- 318 4th Ave
- 409 Terry St Unit B
- 422 Atwood St
- 1403 Emery St
- 911 Kimbark St
- 917 Kimbark St
- 921 Kimbark St
- 904 Kimbark St
- 902 Kimbark St
- 912 Kimbark St
- 926 Main St
- 914 Kimbark St
- 901 Main St
- 930 Main St
- 830 Kimbark St
- 916 Kimbark St
- 903 Main St Unit 903 Main Street, Unit 205
- 903 Main St
- 905 Emery St
- 909 Emery St
- 406 9th Ave
- 828 Kimbark St
- 911 Emery St
- 926 Kimbark St
Your Personal Tour Guide
Ask me questions while you tour the home.