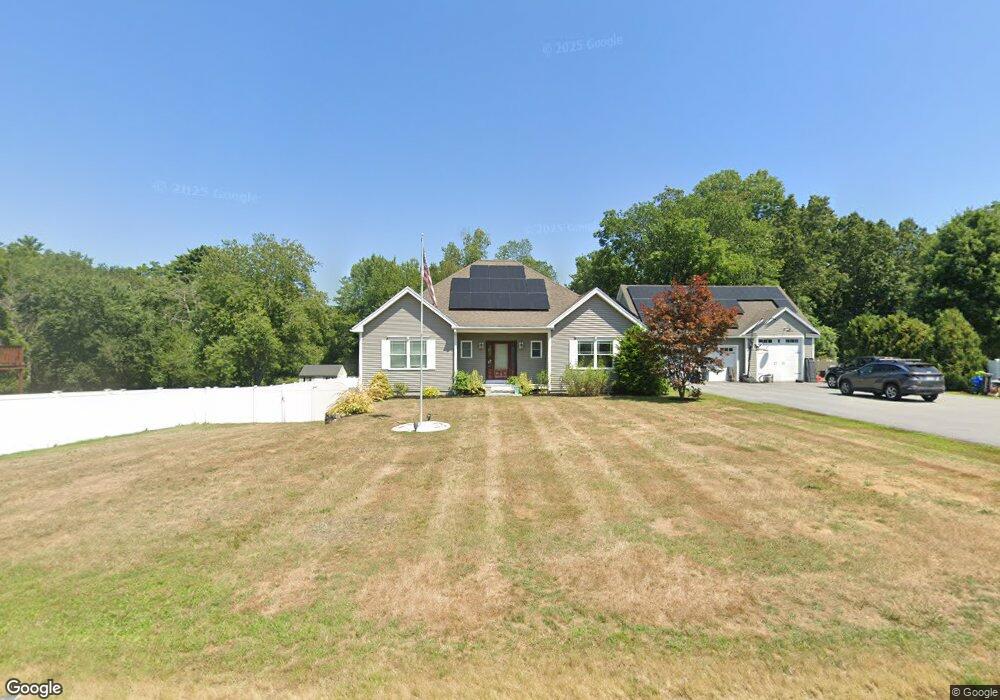
500 Bodwell Rd Manchester, NH 03109
Lower South Willow NeighborhoodEstimated Value: $603,000 - $659,000
2
Beds
1
Bath
648
Sq Ft
$972/Sq Ft
Est. Value
About This Home
This home is located at 500 Bodwell Rd, Manchester, NH 03109 and is currently estimated at $630,166, approximately $972 per square foot. 500 Bodwell Rd is a home located in Hillsborough County with nearby schools including Henry J. McLaughlin Middle School, Manchester Memorial High School, and Cardinal Lacroix Academy.
Ownership History
Date
Name
Owned For
Owner Type
Purchase Details
Closed on
Sep 30, 2020
Sold by
Brennan Patrick J and Brennan Sahah W
Bought by
Sarah W Brennan Ft
Current Estimated Value
Purchase Details
Closed on
Sep 11, 2018
Sold by
Bruce T Barnard
Bought by
Brennan Sarah and Brennan Patricia
Home Financials for this Owner
Home Financials are based on the most recent Mortgage that was taken out on this home.
Original Mortgage
$245,000
Interest Rate
4.54%
Purchase Details
Closed on
Oct 16, 2013
Sold by
Brennan Francis J
Bought by
Brennan Patrick J and Brennan Sarah W
Purchase Details
Closed on
Sep 23, 2013
Sold by
Brennan Patrick J and Brennan Sarah W
Bought by
Brennan Francis J
Purchase Details
Closed on
Oct 28, 2009
Sold by
Hitchen Lily E
Bought by
Brennan Francis J
Create a Home Valuation Report for This Property
The Home Valuation Report is an in-depth analysis detailing your home's value as well as a comparison with similar homes in the area
Home Values in the Area
Average Home Value in this Area
Purchase History
| Date | Buyer | Sale Price | Title Company |
|---|---|---|---|
| Sarah W Brennan Ft | -- | None Available | |
| Sarah W Brennan Ft | -- | None Available | |
| Brennan Sarah | -- | -- | |
| Brennan Patrick J | $258,000 | -- | |
| Brennan Patrick J | $258,000 | -- | |
| Brennan Francis J | -- | -- | |
| Brennan Francis J | -- | -- | |
| Brennan Francis J | $100,000 | -- | |
| Brennan Francis J | $100,000 | -- |
Source: Public Records
Mortgage History
| Date | Status | Borrower | Loan Amount |
|---|---|---|---|
| Previous Owner | Brennan Francis J | $245,000 | |
| Previous Owner | Brennan Francis J | -- | |
| Closed | Brennan Francis J | $0 |
Source: Public Records
Tax History Compared to Growth
Tax History
| Year | Tax Paid | Tax Assessment Tax Assessment Total Assessment is a certain percentage of the fair market value that is determined by local assessors to be the total taxable value of land and additions on the property. | Land | Improvement |
|---|---|---|---|---|
| 2024 | $10,009 | $511,200 | $133,000 | $378,200 |
| 2023 | $9,641 | $511,200 | $133,000 | $378,200 |
| 2022 | $9,324 | $511,200 | $133,000 | $378,200 |
| 2021 | $9,038 | $511,200 | $133,000 | $378,200 |
| 2020 | $8,717 | $353,500 | $91,700 | $261,800 |
| 2019 | $8,597 | $353,500 | $91,700 | $261,800 |
| 2018 | $8,275 | $353,500 | $91,700 | $261,800 |
| 2017 | $7,496 | $353,500 | $91,700 | $261,800 |
| 2016 | $8,180 | $353,500 | $91,700 | $261,800 |
| 2015 | $6,685 | $285,200 | $91,700 | $193,500 |
| 2014 | $6,702 | $285,200 | $91,700 | $193,500 |
| 2013 | $7,422 | $327,400 | $91,700 | $235,700 |
Source: Public Records
Map
Nearby Homes
- 593 Cohas Ave
- 759 Cohas Ave
- 195 Corning Rd
- 133 Corning Rd
- 126 Cohas Ave
- 30 Bryant Rd
- 1035 S Mammoth Rd Unit 6
- 12 Forest Hill Way Unit 57
- 116 Roysan St
- 90 Forest Hill Way Unit 52
- 380 Woodcrest Ct
- lot 719-1 & 2 Sheffield Rd
- 10100 S Willow St Unit 214
- 10100 S Willow St Unit 101
- 10100 S Willow St Unit 109
- 10100 S Willow St Unit 207
- 10100 S Willow St Unit 110
- 10100 S Willow St Unit 204
- 22 Eastmeadow Way
- 193 Morning Glory Dr
- 484 Bodwell Rd
- 510 Bodwell Rd
- 512 Bodwell Rd
- 507 Bodwell Rd
- 501 Bodwell Rd
- 483 Bodwell Rd
- 516 Bodwell Rd
- 509 Bodwell Rd
- 436 Bodwell Rd
- 511 Bodwell Rd
- 534 Bodwell Rd
- 40 Lone Pine Dr
- 461 Bodwell Rd
- 521 Bodwell Rd
- 513 Bodwell Rd
- 540 Bodwell Rd
- 420 Bodwell Rd
- 449 Bodwell Rd
- 50 Lone Pine Dr
- 566 Bodwell Rd