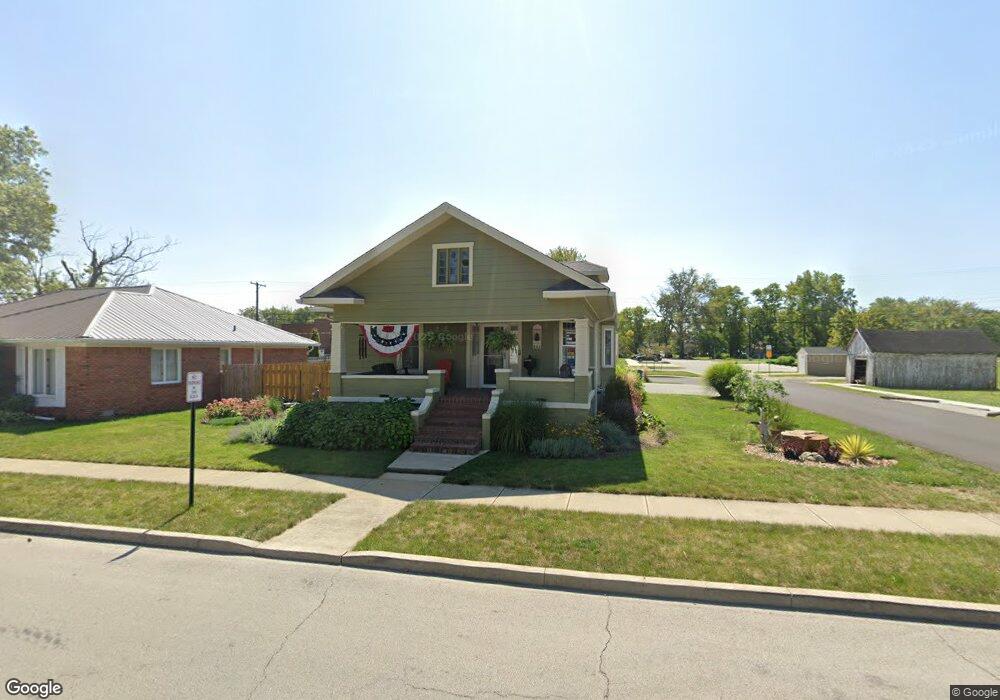
500 E 2nd St Sheridan, IN 46069
Estimated Value: $153,000 - $237,000
2
Beds
1
Bath
1,243
Sq Ft
$158/Sq Ft
Est. Value
About This Home
This home is located at 500 E 2nd St, Sheridan, IN 46069 and is currently estimated at $196,786, approximately $158 per square foot. 500 E 2nd St is a home located in Hamilton County with nearby schools including Sheridan Elementary School, Sheridan Middle School, and Sheridan High School.
Ownership History
Date
Name
Owned For
Owner Type
Purchase Details
Closed on
Apr 8, 2005
Sold by
Neff Susan L
Bought by
Pearson James R and Neff Susan L
Current Estimated Value
Home Financials for this Owner
Home Financials are based on the most recent Mortgage that was taken out on this home.
Original Mortgage
$80,000
Interest Rate
5.88%
Mortgage Type
New Conventional
Purchase Details
Closed on
Sep 6, 2001
Sold by
First Farmers Bank & Trust
Bought by
Neff Susan L
Home Financials for this Owner
Home Financials are based on the most recent Mortgage that was taken out on this home.
Original Mortgage
$57,000
Interest Rate
7.03%
Mortgage Type
Seller Take Back
Purchase Details
Closed on
Feb 8, 2001
Sold by
Pickett John P
Bought by
First Farmers Bank & Trust
Create a Home Valuation Report for This Property
The Home Valuation Report is an in-depth analysis detailing your home's value as well as a comparison with similar homes in the area
Home Values in the Area
Average Home Value in this Area
Purchase History
| Date | Buyer | Sale Price | Title Company |
|---|---|---|---|
| Pearson James R | -- | -- | |
| Neff Susan L | -- | Stewart Title | |
| First Farmers Bank & Trust | -- | -- |
Source: Public Records
Mortgage History
| Date | Status | Borrower | Loan Amount |
|---|---|---|---|
| Closed | Pearson James R | $80,000 | |
| Closed | Neff Susan L | $57,000 |
Source: Public Records
Tax History
| Year | Tax Paid | Tax Assessment Tax Assessment Total Assessment is a certain percentage of the fair market value that is determined by local assessors to be the total taxable value of land and additions on the property. | Land | Improvement |
|---|---|---|---|---|
| 2025 | $1,662 | $170,500 | $29,400 | $141,100 |
| 2024 | $1,587 | $148,100 | $29,400 | $118,700 |
| 2023 | $1,612 | $144,300 | $29,400 | $114,900 |
| 2022 | $1,531 | $132,800 | $29,400 | $103,400 |
| 2021 | $1,357 | $117,900 | $29,400 | $88,500 |
| 2020 | $1,322 | $115,500 | $29,400 | $86,100 |
| 2019 | $1,317 | $115,100 | $12,300 | $102,800 |
| 2018 | $1,234 | $107,900 | $12,300 | $95,600 |
| 2017 | $1,087 | $98,800 | $12,300 | $86,500 |
| 2016 | $1,055 | $99,400 | $12,300 | $87,100 |
| 2014 | $901 | $89,400 | $20,800 | $68,600 |
| 2013 | $901 | $85,900 | $20,800 | $65,100 |
Source: Public Records
Map
Nearby Homes
- 509 1/2 E 1st St
- 514 E 2nd St
- 400 S Georgia St
- 903&905 S Georgia St
- 108 W 3rd St
- 100 S California St
- 390 W State Road 38
- 24453 Kercheval St
- 24485 Godby St
- 24510 Godby St
- 24486 Godby St
- 707 S Hamilton Ave
- 24498 Godby St
- 3345 Godby Dr
- 407 W 8th St
- 2710 W State Road 38
- 511 W 6th St
- 1141 S Malott St
- 606 W 2nd St
- 286 Th St
Your Personal Tour Guide
Ask me questions while you tour the home.