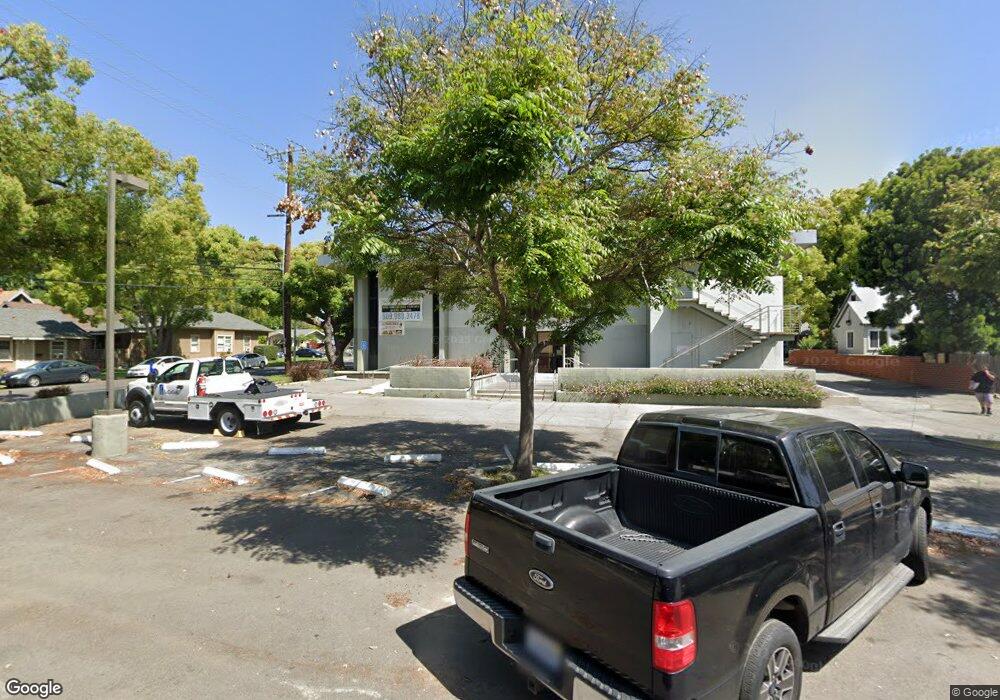
500 E E St Unit 114 Ontario, CA 91764
Downtown Ontario Neighborhood
2
Beds
1
Bath
11,868
Sq Ft
18,731
Sq Ft Lot
About This Home
This home is located at 500 E E St Unit 114, Ontario, CA 91764. 500 E E St Unit 114 is a home located in San Bernardino County with nearby schools including Central Language Academy, Vina Danks Middle, and Chaffey High School.
Ownership History
Date
Name
Owned For
Owner Type
Purchase Details
Closed on
Jun 14, 2016
Sold by
Thurin Christopher P
Bought by
Ramurnik Llc
Home Financials for this Owner
Home Financials are based on the most recent Mortgage that was taken out on this home.
Original Mortgage
$1,335,000
Outstanding Balance
$1,062,512
Interest Rate
3.57%
Mortgage Type
Commercial
Purchase Details
Closed on
Oct 19, 2004
Sold by
Shah Gautam R
Bought by
Thurin Christopher P and Thurin Pamela J
Purchase Details
Closed on
Aug 20, 1996
Sold by
C Theraldson Wayne R Argabright Samuel L
Bought by
Liu Shah and Liu Chiu
Purchase Details
Closed on
Sep 15, 1995
Sold by
Argabright Wayne R
Bought by
C Tharaldson Wayne R Argabright Samuel L
Purchase Details
Closed on
Jun 24, 1992
Sold by
Tharaldson Anne
Bought by
C Tharaldson Wayne R Argabright Samuel L
Create a Home Valuation Report for This Property
The Home Valuation Report is an in-depth analysis detailing your home's value as well as a comparison with similar homes in the area
Home Values in the Area
Average Home Value in this Area
Purchase History
| Date | Buyer | Sale Price | Title Company |
|---|---|---|---|
| Ramurnik Llc | $1,650,000 | Fidelity National Title | |
| Thurin Christopher P | $1,050,000 | Fidelity-Riverside | |
| Shah Gautam R | -- | Fidelity-Riverside | |
| Liu Samuel Liang Chu | -- | Fidelity-Riverside | |
| Chiu Albert Shek Cheung | -- | Fidelity-Riverside | |
| Shah Gautam R | -- | Fidelity-Riverside | |
| Liu Shah | -- | -- | |
| C Tharaldson Wayne R Argabright Samuel L | -- | -- | |
| C Tharaldson Wayne R Argabright Samuel L | -- | -- |
Source: Public Records
Mortgage History
| Date | Status | Borrower | Loan Amount |
|---|---|---|---|
| Open | Ramurnik Llc | $1,335,000 |
Source: Public Records
Tax History
| Year | Tax Paid | Tax Assessment Tax Assessment Total Assessment is a certain percentage of the fair market value that is determined by local assessors to be the total taxable value of land and additions on the property. | Land | Improvement |
|---|---|---|---|---|
| 2025 | $16,857 | $1,533,019 | $355,139 | $1,177,880 |
| 2024 | $16,473 | $1,502,959 | $348,175 | $1,154,784 |
| 2023 | $16,010 | $1,473,489 | $341,348 | $1,132,141 |
| 2022 | $15,798 | $1,444,597 | $334,655 | $1,109,942 |
| 2021 | $15,700 | $1,416,271 | $328,093 | $1,088,178 |
| 2020 | $15,424 | $1,401,749 | $324,729 | $1,077,020 |
| 2019 | $15,292 | $1,374,264 | $318,362 | $1,055,902 |
| 2018 | $15,081 | $1,347,318 | $312,120 | $1,035,198 |
| 2017 | $14,540 | $1,320,900 | $306,000 | $1,014,900 |
| 2016 | $12,969 | $1,202,291 | $180,156 | $1,022,135 |
| 2015 | $12,882 | $1,184,232 | $177,450 | $1,006,782 |
| 2014 | $12,480 | $1,161,035 | $173,974 | $987,061 |
Source: Public Records
Map
Nearby Homes
Your Personal Tour Guide
Ask me questions while you tour the home.