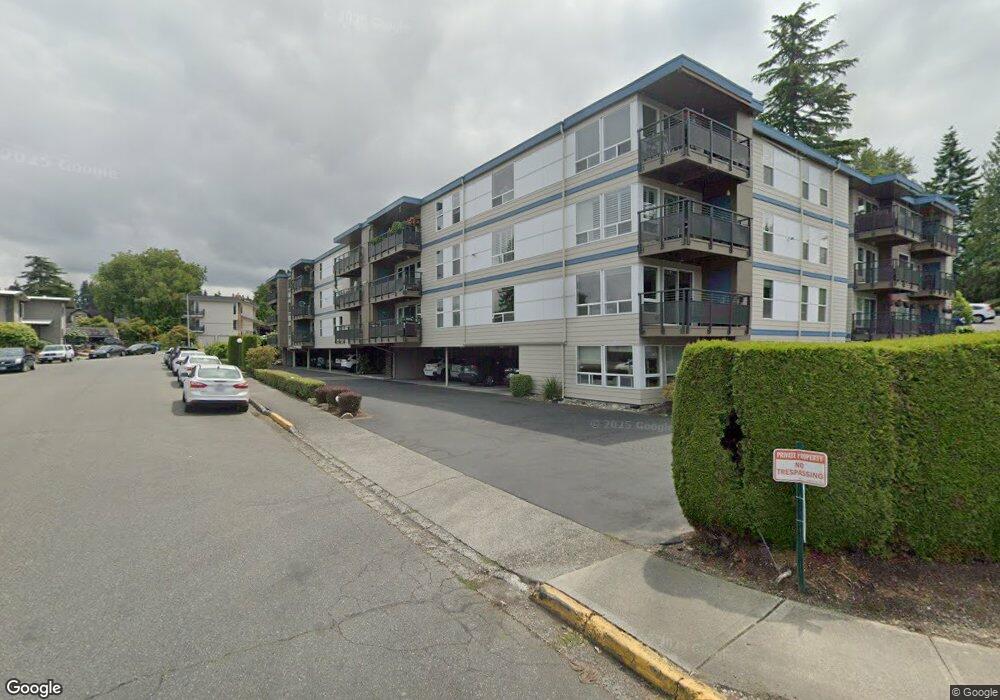
500 Elm Way Unit 45 Edmonds, WA 98020
Pine Park NeighborhoodEstimated Value: $361,000 - $714,000
1
Bed
1
Bath
664
Sq Ft
$741/Sq Ft
Est. Value
About This Home
This home is located at 500 Elm Way Unit 45, Edmonds, WA 98020 and is currently estimated at $492,018, approximately $740 per square foot. 500 Elm Way Unit 45 is a home located in Snohomish County with nearby schools including Sherwood Elementary School, College Place Middle School, and Edmonds-Woodway High School.
Ownership History
Date
Name
Owned For
Owner Type
Purchase Details
Closed on
Jan 29, 2014
Sold by
Morris Steven D and Morris Julie K
Bought by
Jones Janice J
Current Estimated Value
Home Financials for this Owner
Home Financials are based on the most recent Mortgage that was taken out on this home.
Original Mortgage
$130,500
Outstanding Balance
$99,037
Interest Rate
4.45%
Mortgage Type
New Conventional
Estimated Equity
$392,981
Purchase Details
Closed on
Mar 27, 2003
Sold by
Hannah Dorothy M
Bought by
Morris Steven D and Morris Julie K
Home Financials for this Owner
Home Financials are based on the most recent Mortgage that was taken out on this home.
Original Mortgage
$116,400
Interest Rate
5.79%
Purchase Details
Closed on
Sep 8, 2000
Sold by
Lamb Donna A
Bought by
Hannah Dorothy M
Purchase Details
Closed on
Jul 7, 1997
Sold by
Alyson Manor Associates
Bought by
Lamb Donna A
Home Financials for this Owner
Home Financials are based on the most recent Mortgage that was taken out on this home.
Original Mortgage
$60,000
Interest Rate
7.93%
Create a Home Valuation Report for This Property
The Home Valuation Report is an in-depth analysis detailing your home's value as well as a comparison with similar homes in the area
Home Values in the Area
Average Home Value in this Area
Purchase History
| Date | Buyer | Sale Price | Title Company |
|---|---|---|---|
| Jones Janice J | $145,000 | Cw Title | |
| Morris Steven D | $145,500 | Lawyers Title Agency | |
| Hannah Dorothy M | $133,500 | Chicago Title Insurance Co | |
| Lamb Donna A | $109,900 | Pacific Northwest Title Co |
Source: Public Records
Mortgage History
| Date | Status | Borrower | Loan Amount |
|---|---|---|---|
| Open | Jones Janice J | $130,500 | |
| Previous Owner | Morris Steven D | $116,400 | |
| Previous Owner | Lamb Donna A | $60,000 |
Source: Public Records
Tax History Compared to Growth
Tax History
| Year | Tax Paid | Tax Assessment Tax Assessment Total Assessment is a certain percentage of the fair market value that is determined by local assessors to be the total taxable value of land and additions on the property. | Land | Improvement |
|---|---|---|---|---|
| 2025 | $2,807 | $345,300 | $149,000 | $196,300 |
| 2024 | $2,807 | $393,100 | $149,000 | $244,100 |
| 2023 | $2,581 | $374,400 | $149,000 | $225,400 |
| 2022 | $2,727 | $325,600 | $135,000 | $190,600 |
| 2020 | $2,367 | $252,600 | $135,000 | $117,600 |
| 2019 | $1,831 | $196,700 | $135,000 | $61,700 |
| 2018 | $2,190 | $203,500 | $135,000 | $68,500 |
| 2017 | $1,892 | $184,000 | $58,000 | $126,000 |
| 2016 | $1,651 | $159,000 | $46,500 | $112,500 |
| 2015 | $1,753 | $159,000 | $43,000 | $116,000 |
| 2013 | $1,689 | $144,500 | $56,500 | $88,000 |
Source: Public Records
Map
Nearby Homes
- 550 Elm Way Unit 408
- 1110 5th Ave S Unit 204
- 1071 4th Ave S Unit 302
- 637 Elm Place
- 1140 3rd Ave S
- 960 5th Ave S Unit 208
- 1221 Coronado Place
- 22628 106th Ave W
- 11110 Algonquin Rd
- 22430 Dogwood Ln
- 22039 98th Place W
- 335 3rd Ave S Unit 203
- 404 3rd Ave S Unit A201
- 22212 98th Ave W
- 816 Walnut St
- 302 6th Ave S
- 233 3rd Ave S Unit 304
- 50 Pine St Unit 103
- 21703 97th Ave W
- 55 Pine St Unit 203
- 500 Elm Way Unit 49
- 500 Elm Way Unit 48
- 500 Elm Way Unit 47
- 500 Elm Way Unit 46
- 500 Elm Way Unit 44
- 500 Elm Way Unit 43
- 500 Elm Way Unit 42
- 500 Elm Way Unit 41
- 500 Elm Way Unit 40
- 500 Elm Way Unit 39
- 500 Elm Way Unit 38
- 500 Elm Way Unit 37
- 500 Elm Way Unit 35
- 500 Elm Way Unit 33
- 500 Elm Way Unit 32
- 500 Elm Way Unit 31
- 500 Elm Way Unit 30
- 500 Elm Way Unit 29
- 500 Elm Way Unit 28