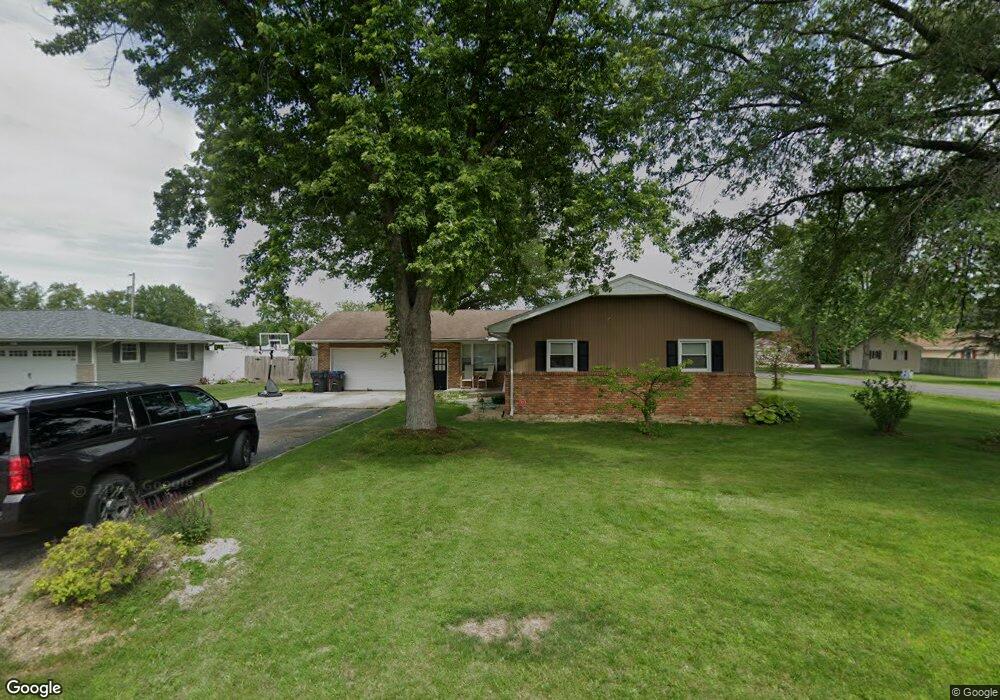
500 Kirk Dr Mount Zion, IL 62549
Estimated Value: $181,392 - $201,000
3
Beds
2
Baths
1,588
Sq Ft
$119/Sq Ft
Est. Value
About This Home
This home is located at 500 Kirk Dr, Mount Zion, IL 62549 and is currently estimated at $188,348, approximately $118 per square foot. 500 Kirk Dr is a home located in Macon County with nearby schools including McGaughey Elementary School, Mt. Zion Intermediate School, and Mt. Zion Elementary School.
Ownership History
Date
Name
Owned For
Owner Type
Purchase Details
Closed on
Jul 8, 2019
Sold by
Stewart Leah L and Stewart Robert
Bought by
Day Alicia N
Current Estimated Value
Home Financials for this Owner
Home Financials are based on the most recent Mortgage that was taken out on this home.
Original Mortgage
$127,153
Outstanding Balance
$111,236
Interest Rate
3.75%
Mortgage Type
FHA
Estimated Equity
$77,112
Purchase Details
Closed on
Nov 26, 2008
Sold by
Pillers Ryan L and Pillers Andrea
Bought by
Elder Leah L
Home Financials for this Owner
Home Financials are based on the most recent Mortgage that was taken out on this home.
Original Mortgage
$122,100
Interest Rate
6.48%
Mortgage Type
FHA
Purchase Details
Closed on
Jun 10, 2008
Sold by
Friend Frank C and Friend Amy S
Bought by
Pillers Ryan L
Home Financials for this Owner
Home Financials are based on the most recent Mortgage that was taken out on this home.
Original Mortgage
$95,000
Interest Rate
6.09%
Mortgage Type
New Conventional
Purchase Details
Closed on
Feb 1, 2003
Create a Home Valuation Report for This Property
The Home Valuation Report is an in-depth analysis detailing your home's value as well as a comparison with similar homes in the area
Home Values in the Area
Average Home Value in this Area
Purchase History
| Date | Buyer | Sale Price | Title Company |
|---|---|---|---|
| Day Alicia N | $128,500 | None Available | |
| Elder Leah L | $125,500 | None Available | |
| Pillers Ryan L | $120,000 | None Available | |
| -- | $97,500 | -- |
Source: Public Records
Mortgage History
| Date | Status | Borrower | Loan Amount |
|---|---|---|---|
| Open | Day Alicia N | $127,153 | |
| Previous Owner | Elder Leah L | $122,100 | |
| Previous Owner | Pillers Ryan L | $95,000 |
Source: Public Records
Tax History Compared to Growth
Tax History
| Year | Tax Paid | Tax Assessment Tax Assessment Total Assessment is a certain percentage of the fair market value that is determined by local assessors to be the total taxable value of land and additions on the property. | Land | Improvement |
|---|---|---|---|---|
| 2024 | $3,365 | $49,114 | $6,050 | $43,064 |
| 2023 | $3,240 | $45,679 | $5,627 | $40,052 |
| 2022 | $3,089 | $43,327 | $5,338 | $37,989 |
| 2021 | $2,984 | $40,589 | $5,000 | $35,589 |
| 2020 | $3,338 | $45,152 | $6,006 | $39,146 |
| 2019 | $3,338 | $45,152 | $6,006 | $39,146 |
| 2018 | $3,232 | $44,000 | $5,853 | $38,147 |
| 2017 | $3,185 | $43,154 | $5,740 | $37,414 |
| 2016 | $3,150 | $42,403 | $5,640 | $36,763 |
| 2015 | $3,045 | $41,983 | $5,584 | $36,399 |
| 2014 | $2,935 | $41,983 | $5,584 | $36,399 |
| 2013 | $2,969 | $41,983 | $5,584 | $36,399 |
Source: Public Records
Map
Nearby Homes
- 125 W Walnut St
- 524 Elm St
- 355 S Henderson St
- 1440 N Alexander Dr
- 1420 Noble Dr
- 265 Carrington Ave
- 5909 Camp Warren Rd
- 1625 Ridgewood Ct
- 6680 John Dr
- 6686 John Dr
- 3930 S Mount Zion Rd
- 1700 Brentwood Dr
- Lot 32 Janine Way
- Lot 3 Fletcher Ln
- Lot 1 Fletcher Ln
- Lot 2 Fletcher Ln
- 695 Country Ct
- 860 W Wildwood Dr
- 1030 Country Manor
- 1610 Robin Ct
- 510 Kirk Dr
- 420 McGaughey Dr
- 405 McGaughey Dr
- 340 McGaughey Dr
- 411 Rolling Green Dr
- 530 Kirk Dr
- 515 Kirk Dr
- 430 McGaughey Dr
- 345 McGaughey Dr
- 420 Kirk Dr
- 345 Maddox Dr
- 501 McGaughey Dr
- 425 Kirk Dr
- 330 McGaughey Dr
- 502 McGaughey Dr
- 335 Maddox Dr
- 412 Rolling Green Dr
- 335 McGaughey Dr
- 515 Maddox Dr
- 515 Maddox Dr