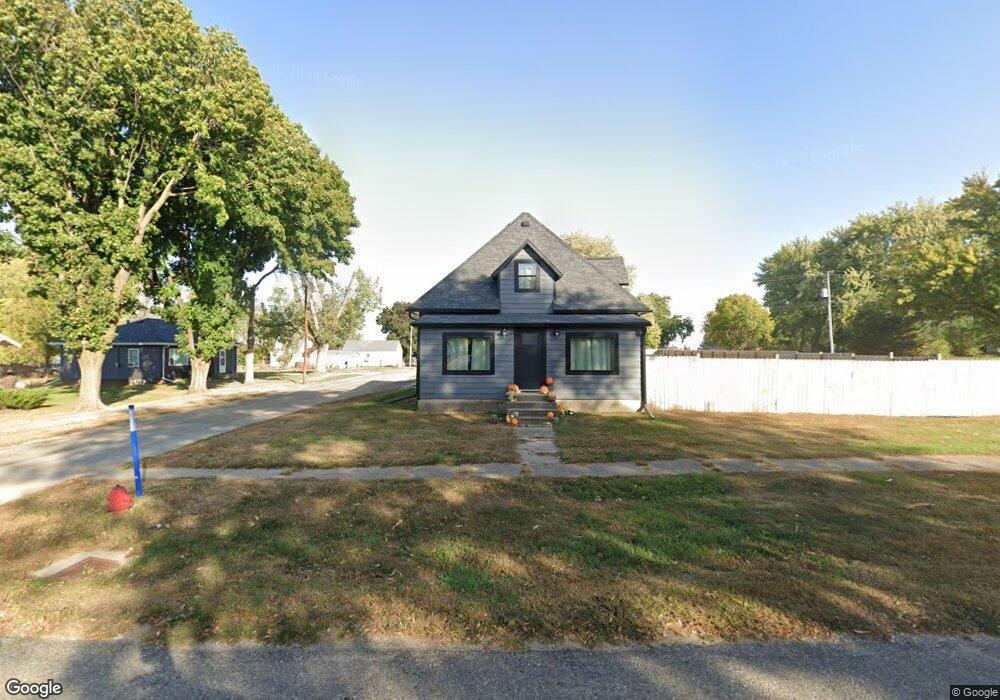
500 Main St Sutherland, IA 51058
Estimated Value: $173,000 - $213,000
3
Beds
2
Baths
1,173
Sq Ft
$160/Sq Ft
Est. Value
About This Home
This home is located at 500 Main St, Sutherland, IA 51058 and is currently estimated at $187,785, approximately $160 per square foot. 500 Main St is a home with nearby schools including South O'Brien Elementary School and South O'Brien Secondary School.
Ownership History
Date
Name
Owned For
Owner Type
Purchase Details
Closed on
May 29, 2024
Sold by
Sweeney Douglas and Sweeney Charlene
Bought by
Zahm Jagger and Zahm Allyson
Current Estimated Value
Home Financials for this Owner
Home Financials are based on the most recent Mortgage that was taken out on this home.
Original Mortgage
$275,323
Outstanding Balance
$215,342
Interest Rate
7.1%
Mortgage Type
New Conventional
Estimated Equity
-$27,557
Purchase Details
Closed on
Jan 25, 2023
Sold by
Helm Steven George
Bought by
Sweeney Douglas and Sweeney Charlene
Home Financials for this Owner
Home Financials are based on the most recent Mortgage that was taken out on this home.
Original Mortgage
$140,000
Interest Rate
6.73%
Mortgage Type
Credit Line Revolving
Purchase Details
Closed on
Aug 9, 2021
Sold by
Putnam John E and Putnam Joyce A
Bought by
Helm Steven George
Create a Home Valuation Report for This Property
The Home Valuation Report is an in-depth analysis detailing your home's value as well as a comparison with similar homes in the area
Purchase History
| Date | Buyer | Sale Price | Title Company |
|---|---|---|---|
| Zahm Jagger | $271,500 | None Listed On Document | |
| Sweeney Douglas | $40,000 | -- | |
| Helm Steven George | $7,500 | None Available |
Source: Public Records
Mortgage History
| Date | Status | Borrower | Loan Amount |
|---|---|---|---|
| Open | Zahm Jagger | $275,323 | |
| Previous Owner | Sweeney Douglas | $140,000 |
Source: Public Records
Tax History
| Year | Tax Paid | Tax Assessment Tax Assessment Total Assessment is a certain percentage of the fair market value that is determined by local assessors to be the total taxable value of land and additions on the property. | Land | Improvement |
|---|---|---|---|---|
| 2025 | $514 | $147,250 | $8,160 | $139,090 |
| 2024 | $514 | $37,710 | $6,530 | $31,180 |
| 2023 | $102 | $36,850 | $6,530 | $30,320 |
| 2022 | $90 | $5,800 | $4,080 | $1,720 |
| 2021 | $90 | $5,800 | $4,080 | $1,720 |
| 2020 | $248 | $7,770 | $3,670 | $4,100 |
| 2019 | $214 | $13,850 | $0 | $0 |
| 2018 | $218 | $13,850 | $0 | $0 |
| 2017 | $284 | $14,070 | $0 | $0 |
| 2016 | $294 | $14,070 | $0 | $0 |
| 2015 | $294 | $14,070 | $0 | $0 |
| 2014 | $312 | $14,070 | $0 | $0 |
Source: Public Records
Map
Nearby Homes
- 310 Linn St
- 206 W Birch St
- 201 Beech St
- 317 S Morse Ave
- 319 S Morse Ave Unit Ave
- 6118 433rd St
- 4233 Yew Ave
- 4545 120th Ave
- 112 Pine St
- 205 E 3rd St
- 418 S Maple St
- 420 S Main St
- 319 N Main St
- 214 N Rutledge St
- 409 W Bertha St
- 1202 450th St
- 655 S Mccormack Ave
- 360 N Albright Ave
- 380 N Albright Ave
- 2285 490th St
Your Personal Tour Guide
Ask me questions while you tour the home.