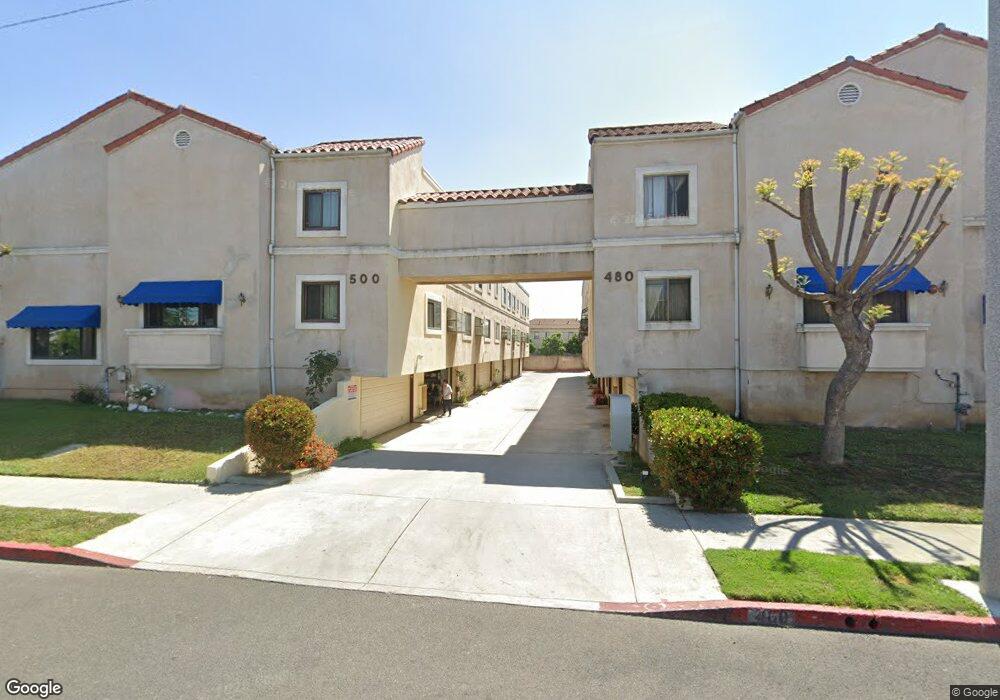
500 N Moore Ave Unit B Monterey Park, CA 91754
Estimated Value: $745,000 - $912,000
3
Beds
3
Baths
1,656
Sq Ft
$503/Sq Ft
Est. Value
About This Home
This home is located at 500 N Moore Ave Unit B, Monterey Park, CA 91754 and is currently estimated at $833,580, approximately $503 per square foot. 500 N Moore Ave Unit B is a home located in Los Angeles County with nearby schools including Ynez Elementary School, Mark Keppel High School, and St. Stephen Martyr School.
Ownership History
Date
Name
Owned For
Owner Type
Purchase Details
Closed on
Jul 6, 2016
Sold by
Chhuor Hav S
Bought by
Chhuor Hav Sou and Chhuor Gigi Ulin
Current Estimated Value
Home Financials for this Owner
Home Financials are based on the most recent Mortgage that was taken out on this home.
Original Mortgage
$334,000
Outstanding Balance
$150,619
Interest Rate
3.44%
Mortgage Type
New Conventional
Estimated Equity
$682,961
Purchase Details
Closed on
Sep 1, 2004
Sold by
Yam Richard
Bought by
Chhuor Hav S
Home Financials for this Owner
Home Financials are based on the most recent Mortgage that was taken out on this home.
Original Mortgage
$288,000
Interest Rate
5.12%
Mortgage Type
Purchase Money Mortgage
Purchase Details
Closed on
Jul 21, 2000
Sold by
Mak Chor H
Bought by
Yam Richard and Yam Ann
Home Financials for this Owner
Home Financials are based on the most recent Mortgage that was taken out on this home.
Original Mortgage
$138,950
Interest Rate
8.2%
Create a Home Valuation Report for This Property
The Home Valuation Report is an in-depth analysis detailing your home's value as well as a comparison with similar homes in the area
Home Values in the Area
Average Home Value in this Area
Purchase History
| Date | Buyer | Sale Price | Title Company |
|---|---|---|---|
| Chhuor Hav Sou | -- | North American Title | |
| Chhuor Hav S | $360,000 | Investors Title Company | |
| Yam Richard | $198,500 | Chicago Title Co |
Source: Public Records
Mortgage History
| Date | Status | Borrower | Loan Amount |
|---|---|---|---|
| Open | Chhuor Hav Sou | $334,000 | |
| Closed | Chhuor Hav S | $288,000 | |
| Previous Owner | Yam Richard | $138,950 | |
| Closed | Chhuor Hav S | $72,000 |
Source: Public Records
Tax History Compared to Growth
Tax History
| Year | Tax Paid | Tax Assessment Tax Assessment Total Assessment is a certain percentage of the fair market value that is determined by local assessors to be the total taxable value of land and additions on the property. | Land | Improvement |
|---|---|---|---|---|
| 2025 | $6,590 | $501,789 | $306,512 | $195,277 |
| 2024 | $6,590 | $491,951 | $300,502 | $191,449 |
| 2023 | $6,457 | $482,306 | $294,610 | $187,696 |
| 2022 | $6,151 | $472,850 | $288,834 | $184,016 |
| 2021 | $6,075 | $463,579 | $283,171 | $180,408 |
| 2019 | $5,859 | $449,831 | $274,773 | $175,058 |
| 2018 | $5,875 | $441,012 | $269,386 | $171,626 |
| 2016 | $5,428 | $423,888 | $258,926 | $164,962 |
| 2015 | $5,344 | $417,522 | $255,037 | $162,485 |
| 2014 | $5,271 | $409,345 | $250,042 | $159,303 |
Source: Public Records
Map
Nearby Homes
- 500 N Moore Ave Unit E
- 516 N Moore Ave Unit A
- 419 N Chandler Ave Unit 311
- 419 N Chandler Ave Unit 308
- 419 N Chandler Ave Unit 302
- 419 N Chandler Ave Unit 307
- 419 N Chandler Ave Unit 413
- 419 N Chandler Ave Unit 520
- 419 N Chandler Ave Unit 305
- 419 N Chandler Ave Unit 319
- 513 N Chandler Ave Unit E
- 218 N Mc Pherrin Ave
- 600 N Atlantic Blvd Unit 508
- 600 N Atlantic Blvd Unit 207
- 600 N Atlantic Blvd Unit 625
- 215 W Garcelon Ave
- 612 W Ramona Rd
- 305 N Baltimore Ave Unit C
- 2037 S 3rd St
- 0 N Atlantic Blvd Unit WS23107010
- 500 N Moore Ave Unit C
- 500 N Moore Ave Unit G
- 500 N Moore Ave Unit F
- 500 N Moore Ave Unit D
- 480 N Moore Ave Unit G
- 480 N Moore Ave Unit F
- 480 N Moore Ave Unit E
- 480 N Moore Ave Unit D
- 480 N Moore Ave Unit C
- 480 N Moore Ave Unit B
- 480 N Moore Ave Unit A
- 512 N Moore Ave
- 424 N Moore Ave
- 516 N Moore Ave
- 516 N Moore Ave #D
- 516 N Moore Ave Unit F
- 516 N Moore Ave Unit E
- 516 N Moore Ave Unit D
- 516 N Moore Ave Unit C
- 516 N Moore Ave Unit B