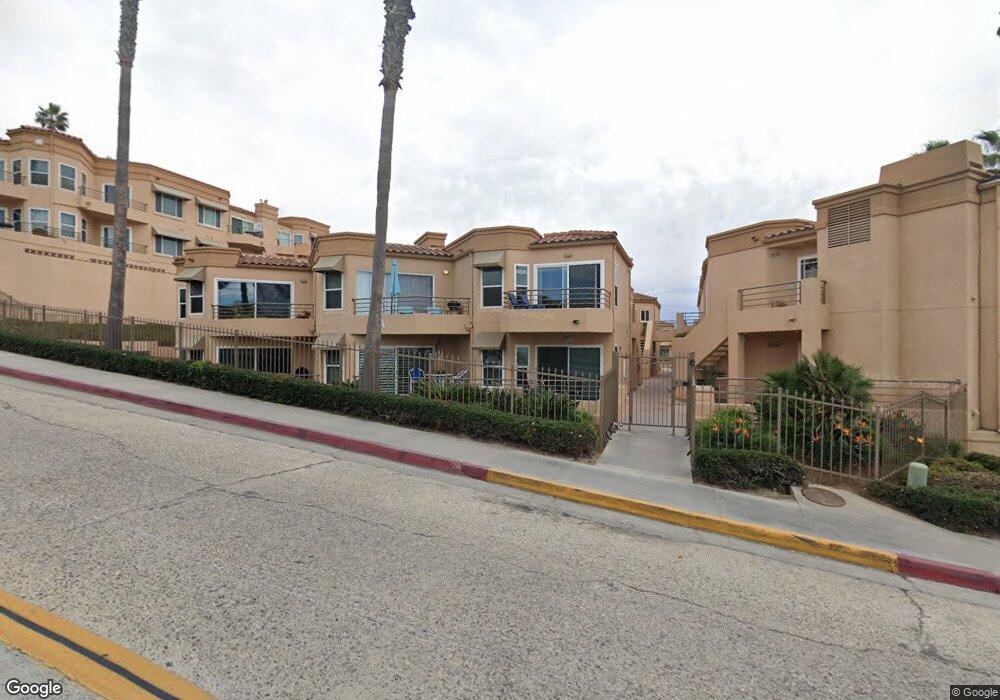
500 N The Strand Unit 58 Oceanside, CA 92054
Downtown Oceanside NeighborhoodEstimated Value: $964,000 - $1,403,000
2
Beds
2
Baths
1,250
Sq Ft
$911/Sq Ft
Est. Value
About This Home
This home is located at 500 N The Strand Unit 58, Oceanside, CA 92054 and is currently estimated at $1,138,286, approximately $910 per square foot. 500 N The Strand Unit 58 is a home located in San Diego County with nearby schools including Laurel Elementary School, Lincoln Middle School, and Oceanside High School.
Ownership History
Date
Name
Owned For
Owner Type
Purchase Details
Closed on
Jun 30, 2010
Sold by
Bui Marguerite L and Odom Wesley E
Bought by
Odom Wesley E and Bui Marguerite Lan
Current Estimated Value
Purchase Details
Closed on
Dec 5, 2000
Sold by
Confluence Corp
Bought by
Odom Wesley E and Bui Marguerite L
Home Financials for this Owner
Home Financials are based on the most recent Mortgage that was taken out on this home.
Original Mortgage
$311,200
Outstanding Balance
$114,433
Interest Rate
7.67%
Mortgage Type
Purchase Money Mortgage
Estimated Equity
$1,023,853
Purchase Details
Closed on
Feb 15, 2000
Sold by
Ritter Loren Lee and Ritter Nancy Lee
Bought by
Confluence Corp
Purchase Details
Closed on
Aug 5, 1999
Sold by
Robert Gilchrist
Bought by
Ritter Loren Lee and Ritter Nancy Lee
Purchase Details
Closed on
Nov 4, 1988
Create a Home Valuation Report for This Property
The Home Valuation Report is an in-depth analysis detailing your home's value as well as a comparison with similar homes in the area
Home Values in the Area
Average Home Value in this Area
Purchase History
| Date | Buyer | Sale Price | Title Company |
|---|---|---|---|
| Odom Wesley E | -- | None Available | |
| Odom Wesley E | $389,000 | Fidelity National Title Co | |
| Confluence Corp | $227,500 | -- | |
| Ritter Loren Lee | $270,000 | Fidelity National Title Co | |
| -- | $189,900 | -- |
Source: Public Records
Mortgage History
| Date | Status | Borrower | Loan Amount |
|---|---|---|---|
| Open | Odom Wesley E | $311,200 | |
| Closed | Odom Wesley E | $38,900 |
Source: Public Records
Tax History Compared to Growth
Tax History
| Year | Tax Paid | Tax Assessment Tax Assessment Total Assessment is a certain percentage of the fair market value that is determined by local assessors to be the total taxable value of land and additions on the property. | Land | Improvement |
|---|---|---|---|---|
| 2025 | $6,470 | $586,137 | $361,630 | $224,507 |
| 2024 | $6,470 | $574,645 | $354,540 | $220,105 |
| 2023 | $6,271 | $563,379 | $347,589 | $215,790 |
| 2022 | $6,177 | $552,333 | $340,774 | $211,559 |
| 2021 | $6,201 | $541,504 | $334,093 | $207,411 |
| 2020 | $6,009 | $535,953 | $330,668 | $205,285 |
| 2019 | $5,835 | $525,445 | $324,185 | $201,260 |
| 2018 | $5,773 | $515,143 | $317,829 | $197,314 |
| 2017 | $5,668 | $505,044 | $311,598 | $193,446 |
| 2016 | $5,485 | $495,142 | $305,489 | $189,653 |
| 2015 | $5,325 | $487,706 | $300,901 | $186,805 |
| 2014 | $5,119 | $478,153 | $295,007 | $183,146 |
Source: Public Records
Map
Nearby Homes
- 400 N The Strand Unit 21
- 400 N The Strand Unit 27
- 503 N Tremont St Unit C
- 801 N Pacific St
- 355 N Cleveland St
- 355 N Cleveland St Unit 206
- 508 N Tremont St Unit A
- 812 N Cleveland St Unit 3
- 812 N Cleveland St Unit 1
- 912 Mira Mar Place
- 580 Sportfisher Dr
- 505 N Freeman St Unit 201
- 718-20 N Freeman St
- 900 N Cleveland St Unit 113
- 900 N Cleveland St Unit 103
- 999 N Pacific St Unit G321
- 999 N Pacific St Unit F101
- 999 N Pacific St Unit C201
- 999 N Pacific St Unit G309
- 999 N Pacific St Unit G316
- 500 N the Strand #45
- 500 N the Strand #53
- 500 N the Strand 31
- 500 N The Strand Unit 38
- 500 N The Strand Unit 43
- 500 N The Strand Unit 42
- 500 N The Strand Unit 41
- 500 N The Strand Unit 40
- 500 N The Strand Unit 37
- 500 N The Strand Unit 36
- 500 N The Strand Unit 35
- 500 N The Strand Unit 34
- 500 N The Strand Unit 33
- 500 N The Strand Unit 32
- 500 N The Strand Unit 31
- 500 N The Strand Unit 30
- 500 N The Strand Unit 29
- 500 N The Strand Unit 60
- 500 N The Strand Unit 59
- 500 N The Strand Unit 56