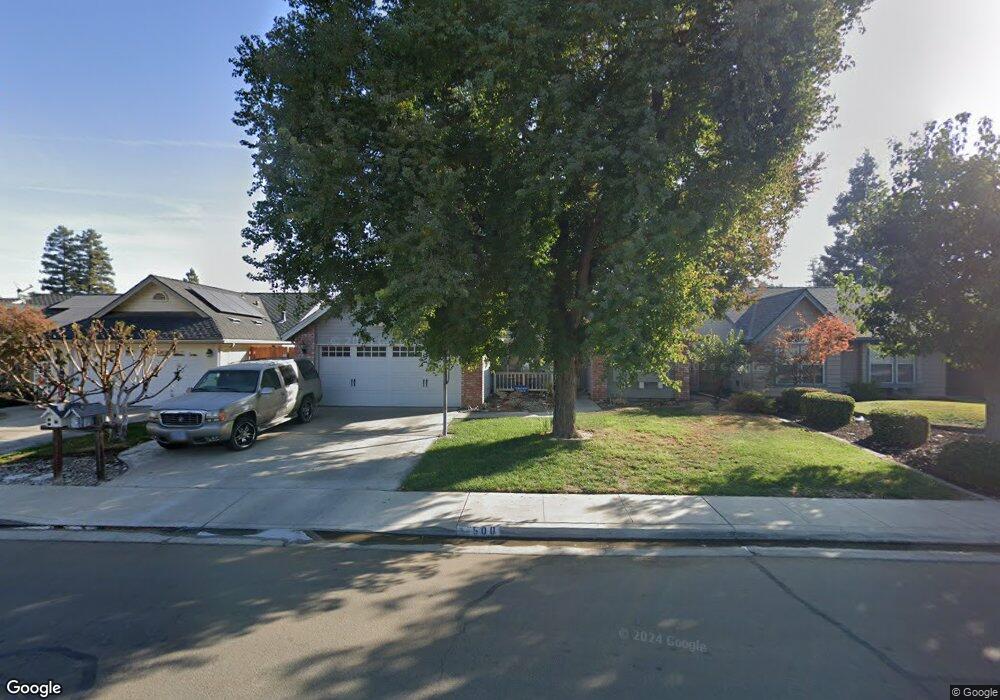
500 N Tommy St Visalia, CA 93291
Northwest Visalia NeighborhoodEstimated Value: $344,000 - $390,000
3
Beds
2
Baths
1,455
Sq Ft
$254/Sq Ft
Est. Value
About This Home
This home is located at 500 N Tommy St, Visalia, CA 93291 and is currently estimated at $369,518, approximately $253 per square foot. 500 N Tommy St is a home located in Tulare County with nearby schools including Hurley Elementary School, Ridgeview Middle, and Redwood High School.
Ownership History
Date
Name
Owned For
Owner Type
Purchase Details
Closed on
Sep 9, 2024
Sold by
Mark A Avedian And Carly J Avedian 2024 and Avedian Mark A
Bought by
Mcav Properties Llc
Current Estimated Value
Purchase Details
Closed on
Apr 17, 2020
Sold by
The Bank Of New York Mellon
Bought by
Avedian Mark and Avedian Carly
Purchase Details
Closed on
Feb 6, 2018
Sold by
Woomer Laura C
Bought by
The Bank Of New York Mellon and The Bank Of New York
Purchase Details
Closed on
Apr 8, 2016
Sold by
Oakwest #1 Of Visalia Homeowners Associa
Bought by
Shetty Satish
Purchase Details
Closed on
Jan 28, 2016
Sold by
Woomer Laura C
Bought by
Oakwest #1 Of Visalia Homeowners Associa
Purchase Details
Closed on
Feb 19, 2004
Sold by
Woomer Stephen J
Bought by
Woomer Laura C
Home Financials for this Owner
Home Financials are based on the most recent Mortgage that was taken out on this home.
Original Mortgage
$147,530
Interest Rate
5.62%
Mortgage Type
FHA
Create a Home Valuation Report for This Property
The Home Valuation Report is an in-depth analysis detailing your home's value as well as a comparison with similar homes in the area
Home Values in the Area
Average Home Value in this Area
Purchase History
| Date | Buyer | Sale Price | Title Company |
|---|---|---|---|
| Mcav Properties Llc | -- | None Listed On Document | |
| Avedian Mark | $203,000 | None Available | |
| The Bank Of New York Mellon | $214,384 | Stewart Title | |
| Shetty Satish | $3,000 | None Available | |
| Oakwest #1 Of Visalia Homeowners Associa | $4,719 | Accommodation | |
| Woomer Laura C | -- | Stewart Title Of California |
Source: Public Records
Mortgage History
| Date | Status | Borrower | Loan Amount |
|---|---|---|---|
| Previous Owner | Woomer Laura C | $147,530 |
Source: Public Records
Tax History Compared to Growth
Tax History
| Year | Tax Paid | Tax Assessment Tax Assessment Total Assessment is a certain percentage of the fair market value that is determined by local assessors to be the total taxable value of land and additions on the property. | Land | Improvement |
|---|---|---|---|---|
| 2025 | $2,337 | $221,459 | $67,804 | $153,655 |
| 2024 | $2,337 | $217,118 | $66,475 | $150,643 |
| 2023 | $2,272 | $212,862 | $65,172 | $147,690 |
| 2022 | $2,171 | $208,690 | $63,895 | $144,795 |
| 2021 | $2,174 | $204,598 | $62,642 | $141,956 |
| 2020 | $2,271 | $213,282 | $60,343 | $152,939 |
| 2019 | $2,205 | $209,100 | $59,160 | $149,940 |
| 2018 | $1,663 | $158,530 | $47,559 | $110,971 |
| 2017 | $1,648 | $155,421 | $46,626 | $108,795 |
| 2016 | $1,615 | $152,374 | $45,712 | $106,662 |
| 2015 | $2,091 | $150,085 | $45,025 | $105,060 |
| 2014 | $1,569 | $147,145 | $44,143 | $103,002 |
Source: Public Records
Map
Nearby Homes
- 415 N Akers St Unit 50
- 415 N Akers St Unit 117
- 415 N Akers St Unit 48
- 415 N Akers St Unit 121
- 6040 W Hurley Ave
- 245 N Boise St
- 415 N Akers Spc 6 St
- 415 N Akers St Unit 9
- 415 N Akers St Unit 17
- 415 N Akers St Unit 84
- 707 N Branson Ct
- 5502 W Nicholas Ct
- 141 N Boise Ct
- 225 N Akers St Unit 308
- 144 S Roeben Ct
- 6346 W Burrel Ct
- 5837 W Stewart Ave
- 5010 W Oak Ave
- 1007 N Atwood St
- 209 S Atwood Ct
- 510 N Tommy St
- 507 N Cottonwood Ct
- 501 N Cottonwood Ct
- 518 N Tommy St
- 434 N Tommy St
- 515 N Cottonwood Ct
- 523 N Cottonwood Ct
- 443 N Cottonwood St
- 509 N Tommy St
- 5911 W Damsen Ave
- 424 N Tommy St
- 528 N Tommy St
- 519 N Tommy St
- 429 N Cottonwood St
- 531 N Cottonwood Ct
- 0 Hurley & Tommy W Unit 20355
- 0 Hurley & Tommy W Unit 11074
- 0 Hurley & Tommy W Unit 11050
- 0 Hurley & Tommy W Unit 223622
- 5921 W Damsen Ave