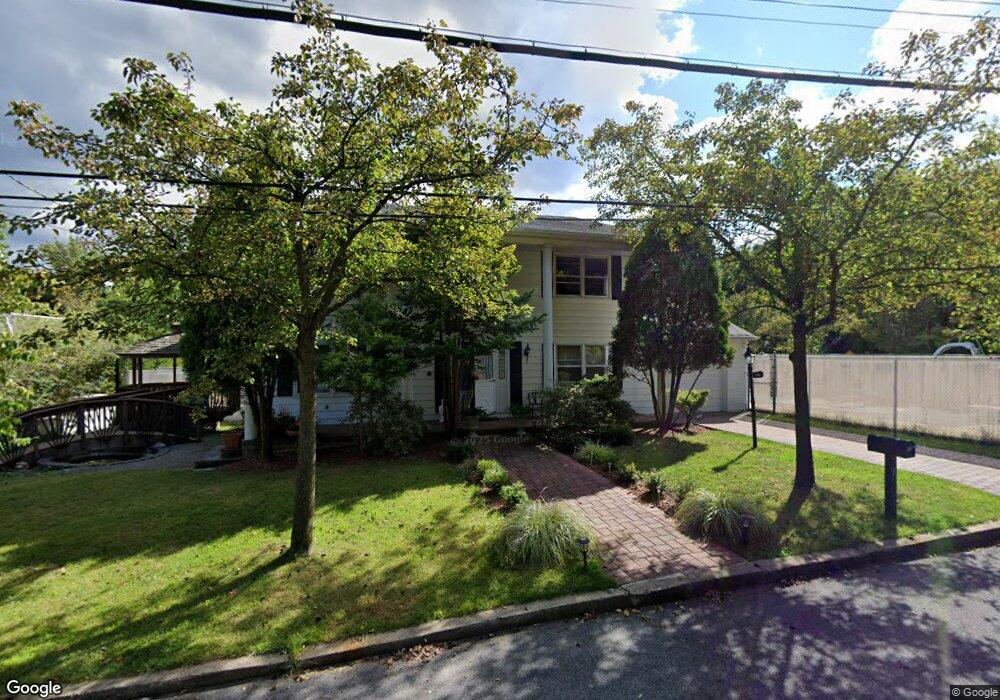
500 Saint George Rd Staten Island, NY 10306
Lighthouse Hill NeighborhoodEstimated Value: $1,177,658 - $1,497,000
3
Beds
2
Baths
3,600
Sq Ft
$378/Sq Ft
Est. Value
About This Home
This home is located at 500 Saint George Rd, Staten Island, NY 10306 and is currently estimated at $1,361,415, approximately $378 per square foot. 500 Saint George Rd is a home located in Richmond County with nearby schools including P.S. 23 Richmondtown, Myra S. Barnes Intermediate School 24, and Susan E Wagner High School.
Ownership History
Date
Name
Owned For
Owner Type
Purchase Details
Closed on
Jul 25, 2017
Sold by
Melkadze Berweek Liya and Melkadze Kakhaber
Bought by
Melkadze Leya
Current Estimated Value
Purchase Details
Closed on
Jun 10, 2008
Sold by
Melkadze Liya and Melkadze Kakhaber
Bought by
Melkadze Liya and Melkadze Kakhaber
Purchase Details
Closed on
Nov 8, 2000
Sold by
Sclafani Angela
Bought by
Melkadze Liya and Melkadze Kakhaber
Home Financials for this Owner
Home Financials are based on the most recent Mortgage that was taken out on this home.
Original Mortgage
$252,700
Interest Rate
7.7%
Purchase Details
Closed on
Sep 9, 1996
Sold by
Sclafani Joseph and Sclafani Angela
Bought by
Sclafani Angela
Create a Home Valuation Report for This Property
The Home Valuation Report is an in-depth analysis detailing your home's value as well as a comparison with similar homes in the area
Home Values in the Area
Average Home Value in this Area
Purchase History
| Date | Buyer | Sale Price | Title Company |
|---|---|---|---|
| Melkadze Leya | -- | None Available | |
| Melkadze Liya | -- | None Available | |
| Melkadze Liya | $465,000 | Stewart Title Insurance Co | |
| Sclafani Angela | $25,000 | Commonwealth Land Title Ins |
Source: Public Records
Mortgage History
| Date | Status | Borrower | Loan Amount |
|---|---|---|---|
| Previous Owner | Melkadze Liya | $252,700 | |
| Closed | Melkadze Liya | $119,300 |
Source: Public Records
Tax History Compared to Growth
Tax History
| Year | Tax Paid | Tax Assessment Tax Assessment Total Assessment is a certain percentage of the fair market value that is determined by local assessors to be the total taxable value of land and additions on the property. | Land | Improvement |
|---|---|---|---|---|
| 2025 | $10,484 | $63,900 | $14,703 | $49,197 |
| 2024 | $10,484 | $52,200 | $18,128 | $34,072 |
| 2023 | $11,233 | $55,309 | $15,763 | $39,546 |
| 2022 | $10,417 | $58,140 | $16,980 | $41,160 |
| 2021 | $10,360 | $61,260 | $16,980 | $44,280 |
| 2020 | $9,830 | $63,780 | $16,980 | $46,800 |
| 2019 | $9,715 | $60,600 | $16,980 | $43,620 |
| 2018 | $9,396 | $46,091 | $14,525 | $31,566 |
| 2017 | $8,564 | $43,483 | $14,773 | $28,710 |
| 2016 | $7,891 | $41,022 | $13,329 | $27,693 |
| 2015 | $7,122 | $38,700 | $14,160 | $24,540 |
| 2014 | $7,122 | $38,700 | $14,160 | $24,540 |
Source: Public Records
Map
Nearby Homes
- 203 Center St
- 443 Edinboro Rd
- 393 Saint Andrews Rd
- 265 Edinboro Rd
- 394 Clarke Ave
- 342 Edinboro Rd
- 219 Ardsley St
- 35 Kensico St
- 312 Barbara St
- 312 London Rd
- 197 Ardsley St
- 93 Aultman Ave
- 31 Franklin Ln Unit A
- 31 Franklin Ln Unit B
- 280 Edinboro Rd
- 265 Barbara St Unit 275
- 265 Lighthouse Ave
- 267 Edinboro Rd
- 256 Thomas St
- 61 Natick St
- 1161 Richmond Hill Rd
- 1161 Picadilly Place
- 492 Saint George Rd
- 475 Saint Andrews Rd
- 486 Saint George Rd
- 459 Saint Andrews Rd
- 476-482 Saint George Rd
- 453 Saint Andrews Rd
- 470 Saint George Rd
- 466 Saint George Rd
- 445 Saint Andrews Rd
- 465 Saint George Rd
- 458 Saint George Rd
- 439 Saint Andrews Rd
- 21 Rigby Ave
- 454 Saint George Rd
- 455 Saint George Rd
- 429 Saint Andrews Rd
- 58 Manor Ct
- 450 Saint George Rd