500 W 12th St Newton, NC 28658
Estimated Value: $138,000 - $172,000
2
Beds
1
Bath
1,056
Sq Ft
$149/Sq Ft
Est. Value
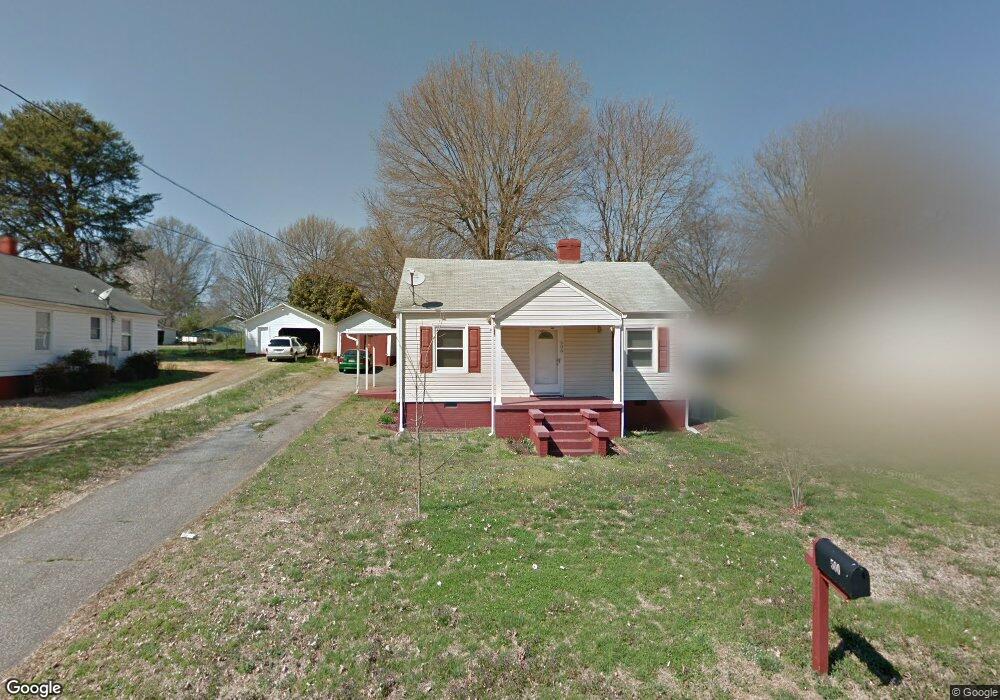
About This Home
This home is located at 500 W 12th St, Newton, NC 28658 and is currently estimated at $157,240, approximately $148 per square foot. 500 W 12th St is a home located in Catawba County with nearby schools including North Newton Elementary School, Newton-Conover Middle School, and Newton-Conover High School.
Ownership History
Date
Name
Owned For
Owner Type
Purchase Details
Closed on
Sep 21, 2009
Sold by
Huffman Ronnie and Huffman Soundra
Bought by
Carter Douglas E
Current Estimated Value
Home Financials for this Owner
Home Financials are based on the most recent Mortgage that was taken out on this home.
Original Mortgage
$48,000
Outstanding Balance
$31,440
Interest Rate
5.22%
Mortgage Type
New Conventional
Estimated Equity
$125,800
Purchase Details
Closed on
Jul 1, 1997
Create a Home Valuation Report for This Property
The Home Valuation Report is an in-depth analysis detailing your home's value as well as a comparison with similar homes in the area
Home Values in the Area
Average Home Value in this Area
Purchase History
| Date | Buyer | Sale Price | Title Company |
|---|---|---|---|
| Carter Douglas E | $60,000 | Chicago Title Insurance Co | |
| -- | $30,000 | -- |
Source: Public Records
Mortgage History
| Date | Status | Borrower | Loan Amount |
|---|---|---|---|
| Open | Carter Douglas E | $48,000 |
Source: Public Records
Tax History Compared to Growth
Tax History
| Year | Tax Paid | Tax Assessment Tax Assessment Total Assessment is a certain percentage of the fair market value that is determined by local assessors to be the total taxable value of land and additions on the property. | Land | Improvement |
|---|---|---|---|---|
| 2025 | $1,313 | $154,800 | $9,500 | $145,300 |
| 2024 | $1,313 | $154,800 | $9,500 | $145,300 |
| 2023 | $1,313 | $154,800 | $9,500 | $145,300 |
| 2022 | $929 | $83,300 | $9,500 | $73,800 |
| 2021 | $929 | $83,300 | $9,500 | $73,800 |
| 2020 | $929 | $83,300 | $9,500 | $73,800 |
| 2019 | $929 | $83,300 | $0 | $0 |
| 2018 | $791 | $70,900 | $9,500 | $61,400 |
| 2017 | $791 | $0 | $0 | $0 |
| 2016 | $791 | $0 | $0 | $0 |
| 2015 | $743 | $70,920 | $9,500 | $61,420 |
| 2014 | $743 | $73,600 | $9,300 | $64,300 |
Source: Public Records
Map
Nearby Homes
- 621 W 13th St
- 204 W 10th St
- 418 W 9th St
- 902 N Ashe Ave
- 210 W 15th St
- 425 W 8th St
- 509 W 8th St
- 00 E 13th St Unit 3
- 00 E 13th St Unit 2
- 1208 N Davis Ave
- 504 N Spring Ave
- 310 W 4th St
- 608 E 11th St
- 1128 McRee Heights Cir
- 112 W 23rd St
- 216 N Davis Ave
- 300 N Ervin Ave
- The Braselton II Plan at Rowe Crossing
- The Harrington Plan at Rowe Crossing
- The Coleman Plan at Rowe Crossing