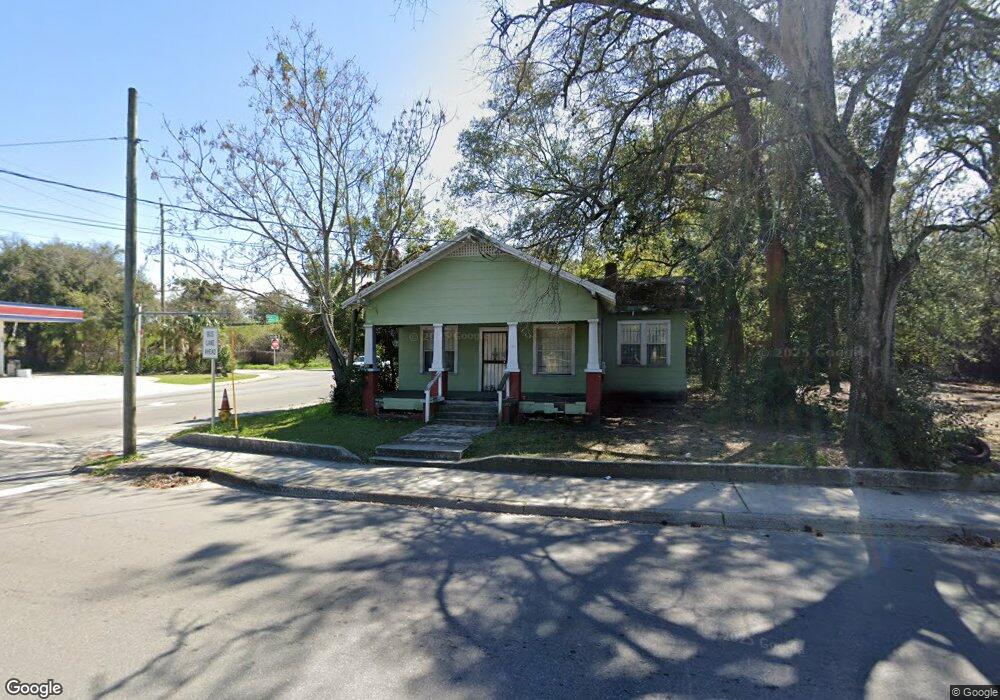
500 W 21st St Jacksonville, FL 32206
Brentwood NeighborhoodEstimated Value: $101,939 - $181,000
3
Beds
1
Bath
1,253
Sq Ft
$107/Sq Ft
Est. Value
About This Home
This home is located at 500 W 21st St, Jacksonville, FL 32206 and is currently estimated at $133,735, approximately $106 per square foot. 500 W 21st St is a home located in Duval County with nearby schools including North Shore Elementary School, Matthew W. Gilbert Middle School, and Jean Ribault High School.
Ownership History
Date
Name
Owned For
Owner Type
Purchase Details
Closed on
Feb 7, 1999
Sold by
Abyssinia Missionary Baptist Church Mini
Bought by
Wynn Mary Alice
Current Estimated Value
Purchase Details
Closed on
Nov 30, 1993
Sold by
Brown Brown Rodney L Rodney L and Brown Addison Sheryl
Bought by
Halyard Morris James
Home Financials for this Owner
Home Financials are based on the most recent Mortgage that was taken out on this home.
Original Mortgage
$27,000
Interest Rate
6.85%
Create a Home Valuation Report for This Property
The Home Valuation Report is an in-depth analysis detailing your home's value as well as a comparison with similar homes in the area
Home Values in the Area
Average Home Value in this Area
Purchase History
| Date | Buyer | Sale Price | Title Company |
|---|---|---|---|
| Wynn Mary Alice | $100 | -- | |
| Halyard Morris James | -- | -- |
Source: Public Records
Mortgage History
| Date | Status | Borrower | Loan Amount |
|---|---|---|---|
| Previous Owner | Halyard Morris James | $27,000 |
Source: Public Records
Tax History Compared to Growth
Tax History
| Year | Tax Paid | Tax Assessment Tax Assessment Total Assessment is a certain percentage of the fair market value that is determined by local assessors to be the total taxable value of land and additions on the property. | Land | Improvement |
|---|---|---|---|---|
| 2025 | $942 | $32,247 | -- | -- |
| 2024 | $927 | $61,912 | $10,827 | $51,085 |
| 2023 | $927 | $63,415 | $9,624 | $53,791 |
| 2022 | $625 | $24,421 | $9,624 | $14,797 |
| 2021 | $597 | $22,027 | $9,624 | $12,403 |
| 2020 | $598 | $21,934 | $9,624 | $12,310 |
| 2019 | $609 | $22,256 | $9,624 | $12,632 |
| 2018 | $614 | $22,297 | $9,624 | $12,673 |
| 2017 | $212 | $15,730 | $0 | $0 |
| 2016 | $212 | $15,407 | $0 | $0 |
| 2015 | $212 | $15,290 | $0 | $0 |
| 2014 | $212 | $15,169 | $0 | $0 |
Source: Public Records
Map
Nearby Homes